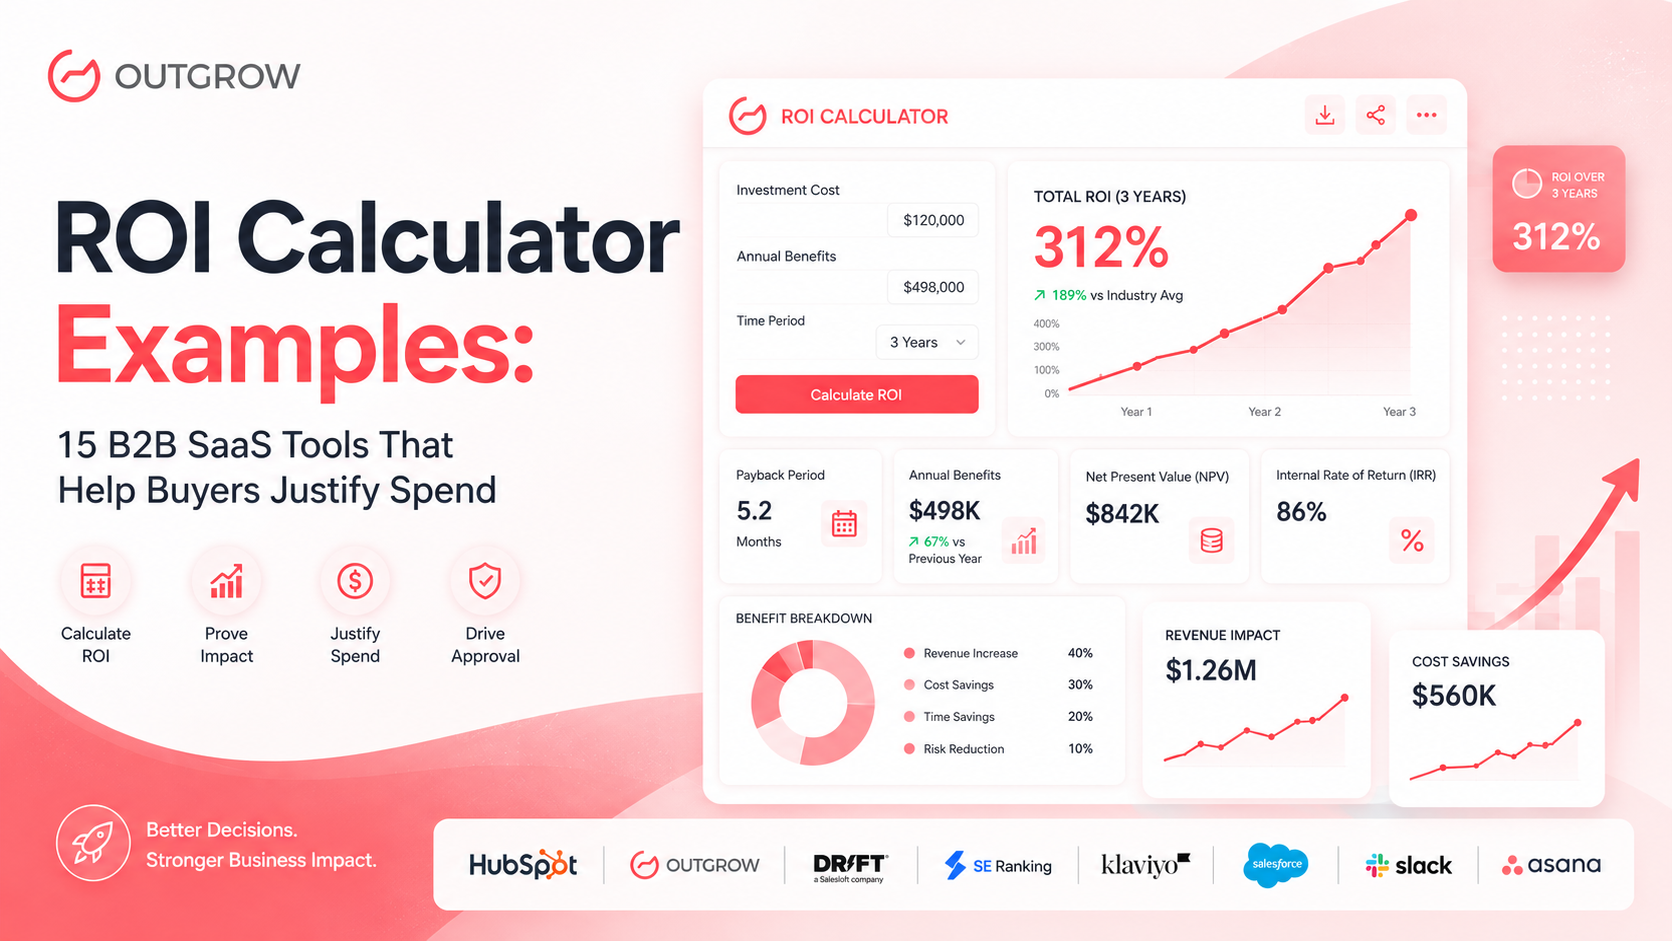
ROI Calculator Examples: 15 B2B SaaS Tools That Help Buyers Justify Spend
Every B2B deal has a moment of truth. The demo went well. Your champion is sold. And then procurement sends the three words that stall more pipelines than any competitor: “We need justification.”
Finance wants a number. Legal wants a business case. The CFO wants to know what happens if this doesn’t work. According to Gartner, 77% of B2B buyers describe their purchasing process as “very complex or difficult”, and the average enterprise buying committee now includes 6 to 10 decision-makers, each with their own definition of value.
This is exactly why the smartest SaaS companies deploy ROI calculators before the contract conversation begins. Not as a sales trick, but as a genuine service to buyers who need to justify spending internally. Forrester research shows that 74% of buyers choose the vendor who first helps them frame their business case, meaning the company that hands a buyer their own financial proof wins the deal, often before competitors even get a follow-up meeting.
ROI calculators work because they convert vendor claims into buyer math. Instead of saying “our platform drives 30% more pipeline,” you let the buyer calculate: “With my 12 reps, my $45K average deal, and my current 18% close rate, that’s $583,200 in additional annual revenue.” That number sticks. It gets screenshotted. It goes into the budget deck.
In this guide, we break down 15 real-world ROI calculator examples, covering Marketing ROI, Cost Savings, and Productivity, across the most trusted B2B SaaS brands. For each one, you’ll see the exact inputs they use, how the math works, and the CTA strategy that converts browsers into buyers. If you’re building your own, we’ll show you how to do it with Outgrow at the end.
What Is an ROI Calculator in B2B SaaS?
Table of Contents
An ROI calculator is an interactive tool that lets a prospective buyer enter their own business data, such as team size, current spend, or conversion rate, and receive a personalized estimate of the financial return they would get from a software product. Unlike a static case study or a PDF one-pager, an ROI calculator generates a unique output for every user, making it the most buyer-specific sales tool in a SaaS company’s content library.
The result is typically displayed as annual revenue gained, hours saved converted to dollars, or costs eliminated, with a payback period in months.
How Do You Calculate ROI for a SaaS Tool?
The standard ROI formula is:
ROI (%) = ((Total Benefits – Total Costs) / Total Costs) × 100
For B2B SaaS specifically, benefits fall into three buckets:
- Revenue generated (more pipeline, higher close rates, faster sales cycles)
- Costs eliminated (tools replaced, admin hours reduced, errors prevented)
- Productivity recovered (hours saved × fully-loaded hourly cost)
Costs include: software licence fee + implementation time + ramp/training time.
Most SaaS ROI calculators simplify this by focusing on the single largest benefit bucket for their product, then comparing it to annual subscription cost to show a payback period.
Who uses B2B SaaS ROI calculators?
- CMOs and demand gen leaders: To justify martech investment and prove channel ROI
- CFOs and finance partners: To evaluate payback period and cost-benefit ratios
- Sales ops and RevOps teams: To build business cases for CRM and sales tool purchases
- HR directors: To quantify the cost of manual processes and justify HRIS investment
- IT leaders: To evaluate platform consolidation and support desk tooling ROI
- Founders and CEOs at growth-stage SaaS: To see when a new tool pays for itself
How Do These 15 ROI Calculator Examples Compare?
Marketing ROI Calculators
| Company | ROI Type | Key Inputs | Primary Output | CTA | Best Takeaway |
|---|---|---|---|---|---|
| HubSpot | Marketing ROI | Website traffic, deal size, close rate | Annual revenue uplift | Start free trial | Ties ROI to revenue, not just leads |
| Outgrow | Marketing ROI | Industry, traffic, conversion rate | Custom ROI score + report | Build your calculator | Uses its own product to prove the concept |
| Drift | Marketing ROI | Rep count, avg deal, pipeline | Revenue per rep increase | Book a demo | Focuses on pipeline velocity |
| SE Ranking | Marketing ROI | Keyword volume, CPC, traffic | Organic traffic dollar value | Start free trial | Translates SEO into money CFOs understand |
| Klaviyo | Marketing ROI | List size, AOV, send frequency | Projected email revenue | Get started | Vertical benchmarks by e-commerce category |
Cost Savings ROI Calculators
| Company | ROI Type | Key Inputs | Primary Output | CTA | Best Takeaway |
|---|---|---|---|---|---|
| Salesforce | Cost Savings | Reps, deal size, win rate | Revenue gain + time recovered | Request demo | Multi-vector ROI for multiple stakeholders |
| Slack | Cost Savings | Team size, meeting hours, tool count | Hours + dollars saved/week | Try Slack free | Backed by Forrester TEI methodology |
| PayPro Global | Cost Savings | MRR, churn, CAC | Break-even timeline in months | Talk to sales | SaaS-native metrics (LTV:CAC ratio) |
| Mews | Cost Savings | Room count, ADR, occupancy | Annual payment savings | Get a demo | Per-room output for hotel asset managers |
| Rippling | Cost Savings | Headcount, HR admin hours, tool count | Annual savings across HR stack | See Rippling | Consolidation ROI across 3+ value levers |
Productivity ROI Calculators
| Company | ROI Type | Key Inputs | Primary Output | CTA | Best Takeaway |
|---|---|---|---|---|---|
| Asana | Productivity | Team size, wasted hours, hourly cost | Hours + dollars recovered | Start trial | Backed by Asana’s Anatomy of Work Index |
| BreatheHR | Productivity | HR team size, admin tasks per week | Hours reclaimed per month | Book a demo | SMB-optimised: 3 fields, instant result |
| Chanty | Productivity | Team size, current tool cost | Monthly savings vs. Slack | Switch to Chanty | Competitive displacement via cost comparison |
| Harvest | Productivity | Billable hours, team size, rate | Annual revenue recovered | Start free | Targets revenue leakage, not cost reduction |
| TimeTrex | Productivity | Employees, wage, error rate | Annual payroll error savings | Get a demo | Compliance risk + efficiency framing |
Data point to embed here: Interactive content like ROI calculators generates 2x more conversions than static landing pages, according to Ion Interactive (now part of Rock Content). Buyers who build their own business case using a vendor’s calculator are 2.1x more likely to complete a purchase than those handed a pre-made case study.
ROI Calculator Performance Benchmarks (B2B SaaS)
| Metric | Industry Average | With ROI Calculator |
|---|---|---|
| Landing page conversion rate | 2.35% | 4.7% to 9.3% |
| Time on page | 52 seconds | 3.5 to 4.5 minutes |
| Lead-to-demo conversion | 8 to 12% | 18 to 26% |
| Sales cycle length | Baseline | 20 to 25% shorter |
| Deal win rate | Baseline | 15 to 20% higher |
Marketing ROI Calculator Examples
What Does a Marketing ROI Calculator Actually Measure?
Marketing ROI calculators answer the question every CMO faces before budget season: “If we invest in this tool, what comes back?” The weak versions track impressions and clicks. The strong ones, like the five below, tie outputs directly to pipeline, revenue, and customer acquisition cost reduction.
Companies that measure marketing ROI are 1.6x more likely to receive higher budgets the following year, according to HubSpot’s State of Marketing Report. The ROI calculator is the mechanism that makes measurement possible before purchase, turning a hypothesis into a number the finance team can approve.
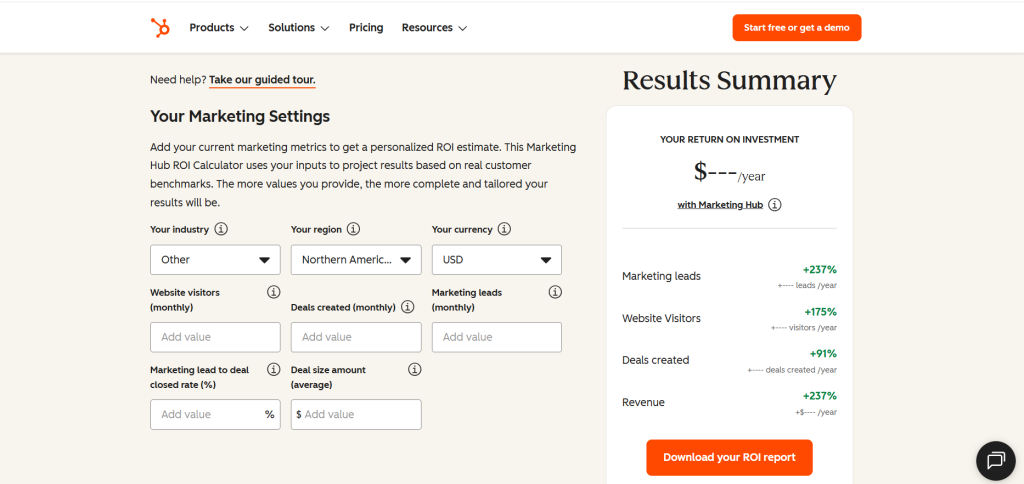
1. HubSpot Marketing ROI Calculator
Company + Use Case: HubSpot built their calculator for marketing managers and CMOs evaluating Marketing Hub. The goal is to reframe HubSpot from a line-item expense into a revenue-generating asset, before the procurement conversation happens.
Inputs They Collect:
- Industry
- Region
- Currency
- Website visitors (monthly)
- Deals created (monthly)
- Marketing leads (monthly)
- Marketing lead to deal closed rate (%)
- Deal size amount (average)
Output Format: A personalized results page showing projected annual increase in leads, opportunities created, and closed revenue, with a percentage uplift against the buyer’s current baseline.
How the Math Works HubSpot benchmarks each user’s funnel conversion rate against median performance for companies of similar size and industry. If your site converts at 1.2% and the HubSpot customer median is 2.1%, the calculator projects the revenue impact of closing that gap, not as a guarantee, but as “what’s possible at the median for your peer group.” The framing is deliberate: it feels like competitive intelligence, not a vendor estimate.
CTA Strategy: “Download Your ROI Report” flows into a soft “Start Free Trial.” The number does the selling; HubSpot doesn’t need to.
Best Takeaway: When buyers see their own numbers in the output, the result becomes their business case, not a vendor pitch. That psychological ownership is what gets the calculator screenshotted and forwarded to the CFO.
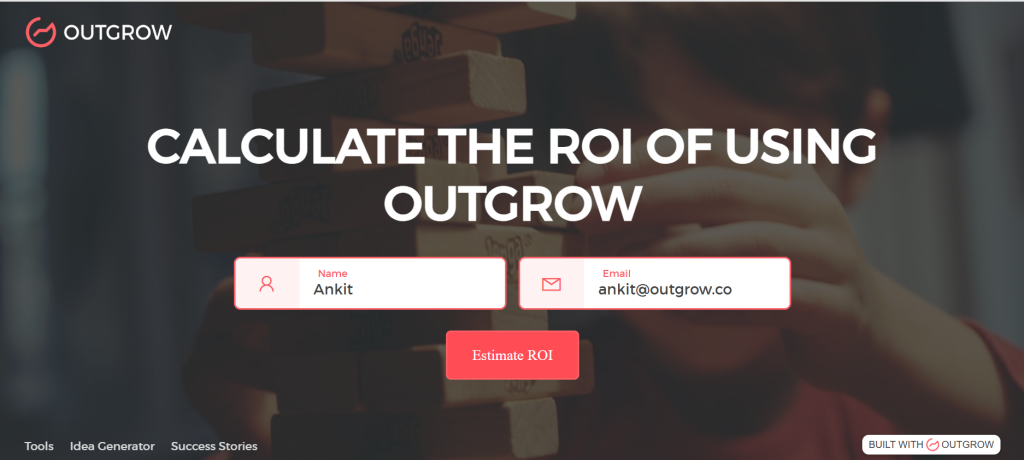
2. Outgrow Marketing ROI Calculator
Company + Use Case: Outgrow’s own calculator is a masterclass in product-as-marketing. It targets marketers evaluating interactive content tools and proves the ROI of calculators by being one. It is the only example in this list where the tool is simultaneously the product demo and the sales tool.
Inputs They Collect:
- How many unique leads do you generate per year?
- What is your lead to sales conversion rate over the last year?
- What is your CLV (Customer Lifetime Value)?
- Last question! What is your monthly marketing budget?
Output Format:
- Leads Without Outgrow
- Leads with Outgrow
- Sales Conversion without Outgrow
- Sales Conversion with Outgrow
- Return on Investment
- New leads
- New sales conversion rate
- Marketing budget invested in Outgrow
A personalised ROI score showing projected conversion rate uplift and additional monthly leads generated from switching to interactive content. Includes a downloadable summary.
Outgrow’s templates library includes free ROI calculator templates for marketing, sales, HR, and operations, ready to customize without writing a single formula from scratch.
💡 How the Math Works Outgrow benchmarks conversion uplift from interactive content (calculators, quizzes, product recommenders) against static content baselines using platform-wide customer data. Formula: (Current monthly leads × uplift multiplier) × average deal value = projected monthly revenue gain. Uplift multipliers range from 1.4x to 3.2x depending on industry and content type, sourced from Outgrow’s published benchmark research.
CTA Strategy: After showing results, the CTA is “Build Your Own ROI Calculator,” turning a prospect into a builder. Brilliant positioning: the moment a buyer imagines using the product, the evaluation is effectively over.
Best Takeaway: Use your own product as your best marketing asset. If you sell ROI calculators, your website’s ROI calculator is the demo.
3. Drift (SalesLoft) Marketing ROI Calculator
Company + Use Case: Now part of SalesLoft, Drift’s calculator targets revenue teams evaluating conversational marketing platforms. It focuses on pipeline velocity: how quickly a lead becomes a conversation, and how much each day of delay costs.

Inputs They Collect:
- How much web traffic does your website have per month?
- What is your average deal size?
- What is your average win rate percentage?
Output Format:
- Total Leads Captured
- Increased Pipeline
- Number of Deals Won
- Closed Won Revenue
Annual revenue uplift from reduced time-to-meeting, increased pipeline coverage per rep, and faster lead response across the team.
How the Math Works The calculator applies XANT (formerly InsideSales.com) research showing that the odds of qualifying a lead drop by 80% after the first 5 minutes of inactivity. It multiplies each hour’s delay by the user’s deal size and rep count to produce a “cost of slow response” figure, then shows what Drift’s real-time engagement recovers.
CTA Strategy: Direct “Book A Free Strategy Call”, appropriate for an enterprise audience that has already self-qualified through the input process.
Best Takeaway: For sales-led SaaS, make the calculator output rep-level, not company-level. Sales leaders respond to “revenue per rep” more viscerally than “total pipeline increase.”
4. SERanking Marketing ROI Calculator
Company + Use Case: SERanking targets SEO managers and digital marketing directors who need to justify organic search investment to stakeholders who don’t think in keywords with ROI Marketing Calculator. They think in budget lines and dollar returns.
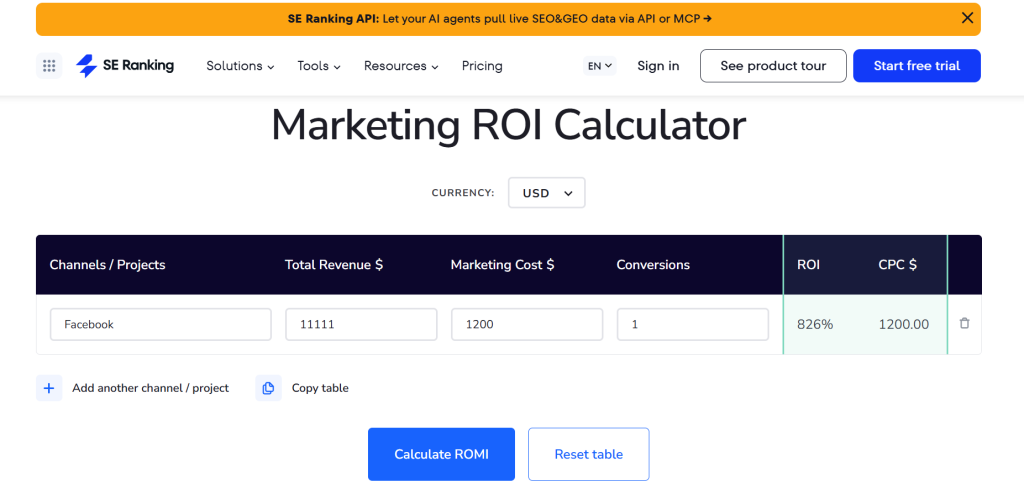
Inputs They Collect:
- Channels / Projects
- Total Revenue$
- Marketing Cost$
- Conversions
- ROI
- CPC$
Output Format: “Organic traffic value,” meaning the equivalent paid media spend required to buy the same traffic through Google Ads, plus projected revenue from ranking improvements over 3 to 6 months.
How the Math Works Core formula: Organic traffic value = (Monthly organic sessions × average CPC). SE Ranking layers typical ranking improvement rates for their platform’s users to project the potential organic value gain. The result converts an SEO metric (search rankings) into a figure any CFO immediately understands.
CTA Strategy: “Go to Report Builder” directly beneath results, with no friction. The tool is free; the upgrade conversation happens after.
Best Takeaway: “Ranking on page 1 for 47 keywords” means nothing to a finance team. “Replacing $47,000/month in paid traffic costs” means everything. Always denominate SEO value in money, not metrics.
5. Klaviyo Email Marketing ROI Calculator
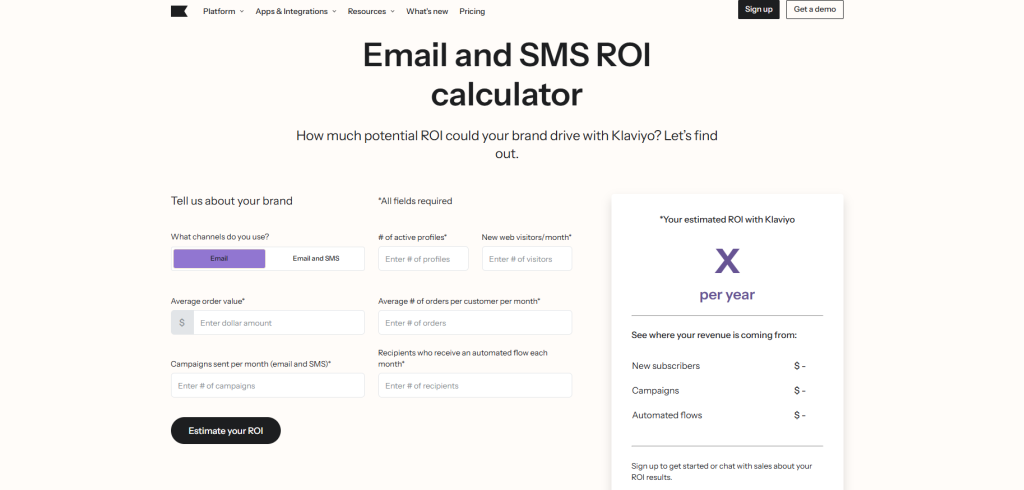
Company + Use Case: Klaviyo’s calculator serves e-commerce brands evaluating email and SMS marketing platforms. The central premise: your email list is a dormant revenue asset. The calculator reveals how much of that revenue you’re currently leaving uncaptured.
Inputs They Collect:
- What channels do you use?
- # of active profiles*
- New web visitors/month*
- Average order value*
- Average # of orders per customer per month*
- Campaigns sent per month (email and SMS)*
- Recipients who receive an automated flow each month*
Output Format:
- New subscribers
- Campaigns
- Automated flows
Projected annual email revenue benchmarked against Klaviyo’s industry averages for the user’s specific vertical, fashion, beauty, food and beverage, home goods, and others.
How the Math Works Klaviyo uses Revenue Per Recipient (RPR) benchmarks segmented by industry. Formula: List size × send frequency × RPR = projected monthly revenue. The “gap” between current and projected email revenue is the headline number, displayed prominently as the opportunity.
CTA Strategy: “Estimate Your ROI.” The calculator has already done the qualification. Low barrier, high intent.
Best Takeaway: Vertical-specific benchmarking dramatically increases credibility. A Shopify fashion brand and a B2B software company have fundamentally different email economics. Calculators that acknowledge this earn more trust than ones that use universal averages.
Data point to embed here: Email marketing generates an average ROI of $36 for every $1 spent , the highest of any digital marketing channel. Klaviyo’s calculator makes this abstract industry state feel concrete and personal.
Cost Savings ROI Calculator Examples
Why Are Cost Savings Calculators the Most Persuasive ROI Tools in Enterprise Sales?
Because they eliminate risk rather than project upside. In enterprise buying, the CFO’s approval is often conditional on one thing: “What’s the downside if this works exactly as promised?” Cost savings calculators answer that question by quantifying what the business is currently losing and what stops the moment the contract is signed.
McKinsey research shows that companies moving to cloud-based SaaS tools reduce operational costs by 15 to 20% on average. Meanwhile, Vendr’s SaaS spend report found that the average mid-market company wastes $135,000 annually on unused or duplicate SaaS subscriptions, money that cost-savings calculators help surface and eliminate.
6. Salesforce Sales ROI Calculator
Company + Use Case: Salesforce’s calculator targets VP Sales and RevOps leaders evaluating CRM investment. It reframes the CRM not as software but as revenue infrastructure, with a multi-stakeholder output that speaks simultaneously to sales, finance, and operations.
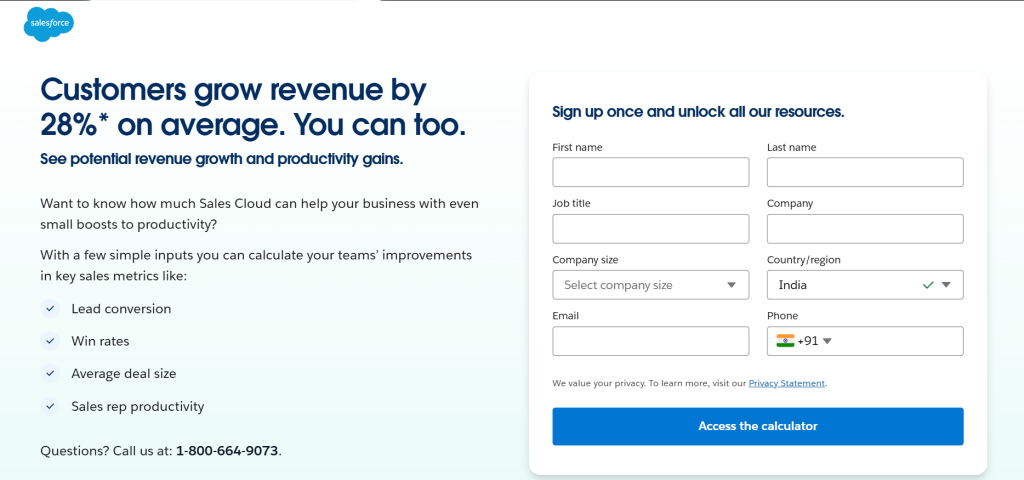
Inputs They Collect:
- First Name
- Last Name
- Job Title
- Company
- Company Size
- Country/Region
- Phone
Output Format: A multi-metric dashboard showing: annual revenue from win rate improvement, time recovered for active selling, and cost reduction from faster new-rep ramp time.
How the Math Works Salesforce uses three parallel formulas:
- Revenue uplift = Reps × avg deal size × win rate improvement (benchmarked at 20 to 29% based on Salesforce customer data)
- Time recovery = Non-selling hours × hourly cost × team size × 52 weeks
- Ramp savings = Weeks saved onboarding × new-hire count × avg rep quota attainment
All three are summed to produce a total annual ROI figure with a payback period in months.
CTA Strategy: “Request a Demo,” gated behind a form that captures firmographic data and intent signals for the AE team.
Best Takeaway: Multi-vector ROI lets each stakeholder find their own reason to buy. Finance sees cost reduction. Sales sees win rate gains. Operations sees onboarding efficiency. One calculator, three champions.
7. Slack Cost Savings Calculator
Company + Use Case: Slack targets IT leaders and operations executives evaluating communication platform consolidation. The calculator focuses on a universally relatable cost driver: the staggering financial weight of unnecessary meetings.
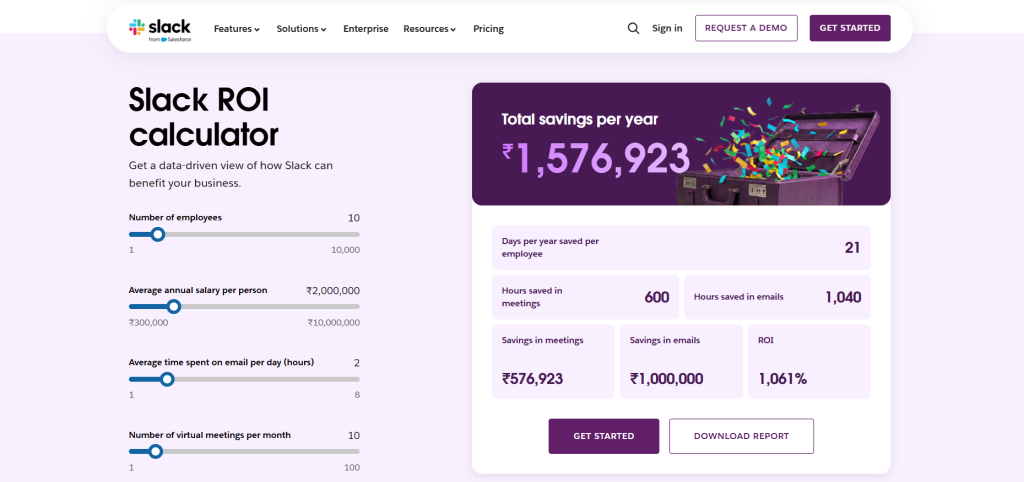
Inputs They Collect:
- Number of employees
- Average annual salary per person
- Average time spent on email per day (hours)
- Number of virtual meetings per month
Output Format:
- Days per year saved per employee
- Hours saved in meetings
- Hours saved in emails
- Savings in meetings
- Savings in emails
- ROI
Weekly hours recovered per team, annualised dollar value of meeting waste eliminated, and annual cost savings from tool consolidation.
How the Math Works Slack uses Forrester’s Total Economic Impact (TEI) methodology as its calculation backbone, a third-party research framework that independently validates the inputs and multipliers used. Meeting waste formula: (Meetings eliminated per person × duration × hourly rate × team size × 52). Tool consolidation uses average per-seat market pricing for replaced software.
CTA Strategy: “Get Started,” offering zero friction after the calculator establishes the financial case.
Best Takeaway: Referencing Forrester TEI methodology in your calculator adds third-party credibility no amount of vendor-generated data can replicate. If you can commission a Forrester TEI study, do it, as it becomes the foundation of every ROI conversation.
8. PayPro Global SaaS Break-Even Calculator
Company + Use Case: PayPro Global targets SaaS founders and CFOs evaluating global payment infrastructure. Their calculator focuses on the break-even question: when does switching payment providers pay for itself?
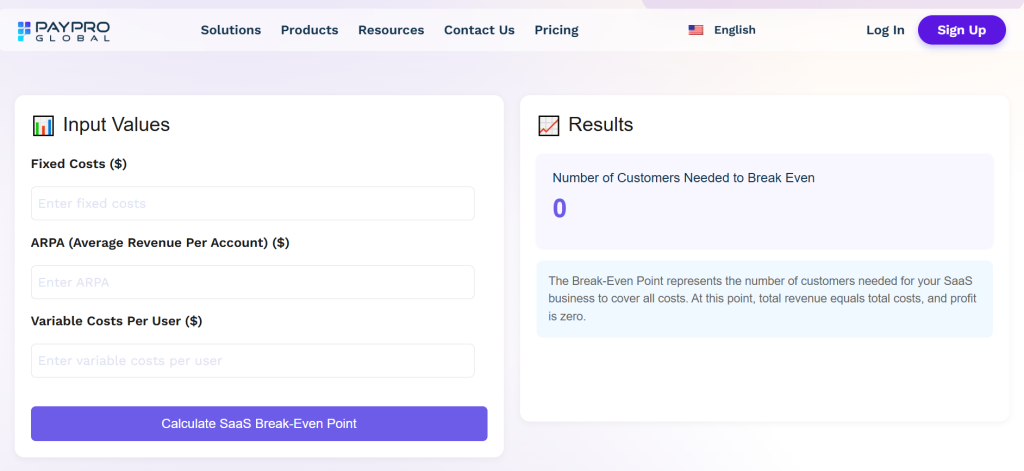
Inputs They Collect:
- Fixed Costs ($)
- ARPA (Average Revenue Per Account) ($)
- Variable Costs Per User ($)
Output Format: Break-even timeline (months), projected MRR at break-even, and LTV:CAC ratio with a benchmark against healthy SaaS targets.
How the Math Works Break-even months = CAC ÷ (ARPU × gross margin %). The calculator then models churn impact on the timeline, showing how a 1% reduction in monthly churn can accelerate break-even by 2 to 3 months. This makes the case for investing in retention infrastructure (including better payment systems that reduce involuntary churn from failed payments) simultaneously.
CTA Strategy: “Talk to Sales”, appropriate for a product where a technical conversation adds value after the calculator establishes intent.
Best Takeaway: Speak to your buyer in their native metrics. “Monthly Recurring Revenue” and “LTV:CAC ratio” signal domain fluency instantly. Calculators that use SaaS-native terminology convert better with SaaS-native buyers.
9. Mews Payments ROI Calculator
Company + Use Case: Mews targets hotel operators and hospitality groups evaluating their property management platform. The calculator isolates a single, highly specific cost driver, payment processing fees, and shows exactly what switching saves per room per year.
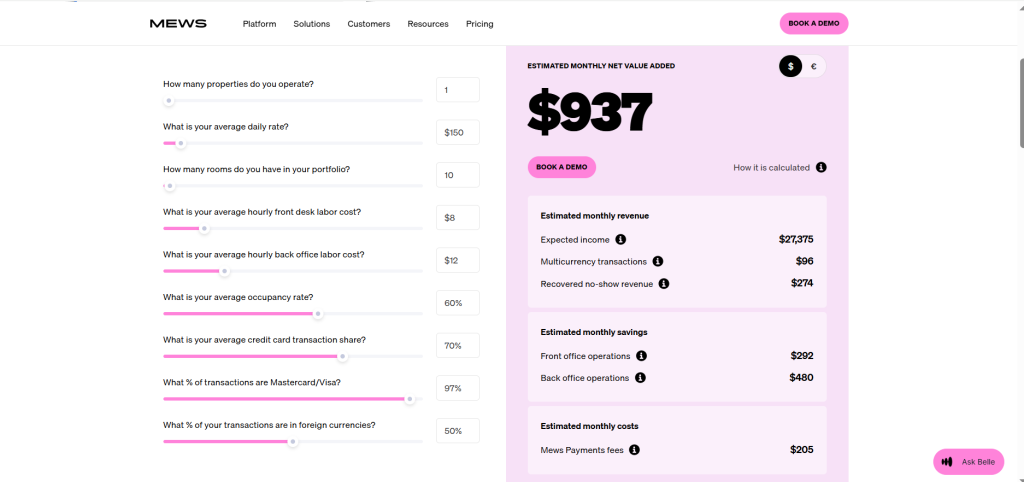
Inputs They Collect:
- How many properties do you operate?
- What is your average daily rate?
- How many rooms do you have in your portfolio?
- What is your average hourly front desk labor cost?
- What is your average hourly back office labor cost?
- What is your average occupancy rate?
- What is your average credit card transaction share?
- What % of transactions are Mastercard/Visa?
- What % of your transactions are in foreign currencies?
Output Format:
- Expected income
- Multicurrency transactions
- Recovered no-show revenue
- Front office operations
- Front office operations
- Mews Payments fees
Annual payment savings displayed as both a total portfolio figure and a per-room-per-year metric, using the unit economics language of hotel asset management.
How the Math Works Payment volume = rooms × ADR × 365 × occupancy rate. Savings = total payment volume × (current fee % − Mews fee %). The per-room output (e.g., “Save £312 per room per year”) is the differentiating calculation. It lets asset managers with 8-property portfolios immediately multiply by their room count to see total impact.
CTA Strategy: “Get a Demo.” The calculator output is specific enough (e.g., “Save £47,200 annually”) to create genuine urgency for a scoped conversation.
Best Takeaway: Vertical-specific calculators win because they use industry-native metrics. “ADR” and “occupancy rate” signal domain expertise before the sales conversation starts. Trust established before the demo is the most durable kind.
10. Rippling HR & IT ROI Calculator
Company + Use Case: Rippling targets HR leaders and CFOs evaluating workforce management platform consolidation. The calculator makes the financial case for replacing 5 to 10 point solutions with a single platform, across three simultaneous ROI streams.
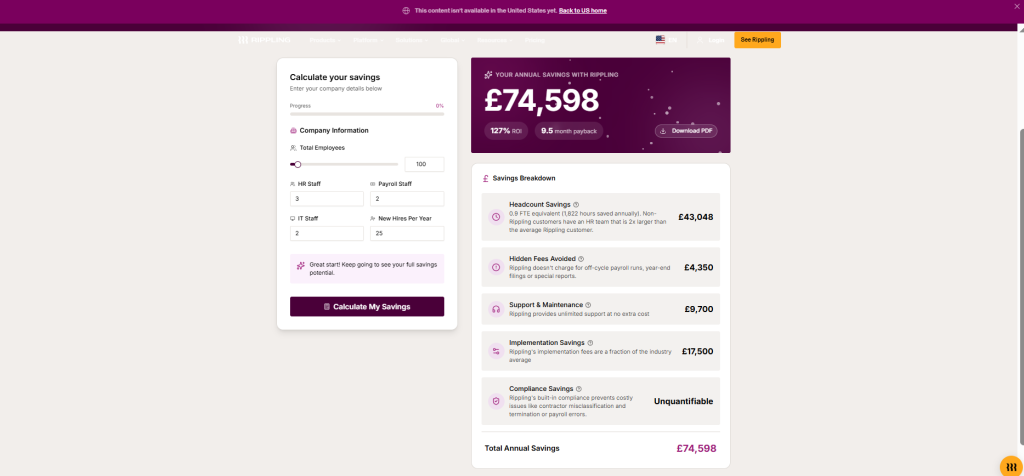
Inputs They Collect:
- Number of employees
- Number of current HR/IT software tools
- Hours HR team spends on admin tasks per week
- Average HR team hourly cost ($)
- Average time to onboard a new employee (hours)
Output Format: Three-part annual ROI summary: tool consolidation savings, HR hours recovered (as dollars), and onboarding cost reduction, summed as total annual savings with a payback period.
How the Math Works
- Tool savings = (current tools × average per-seat cost) − Rippling pricing
- Admin savings = (hours saved per week × hourly rate × HR team size × 52)
- Onboarding savings = (hours reduced × avg employee cost × annual new hires)
All three figures sum to the total annual ROI. Rippling benchmarks the “hours saved” multiplier from customer-reported data post-implementation.
CTA Strategy: “Calculate My Savings,” a confident, brand-forward choice. The calculator has done its job.
Best Takeaway: Multi-stream ROI calculators are especially powerful for platform plays. They let the buyer discover their own biggest value driver, often finding a ROI dimension they hadn’t considered when they started the evaluation.
Productivity ROI Calculator Examples
How Do B2B SaaS Companies Put a Dollar Figure on Productivity?
The answer: attach hours to wages, then scale annually. McKinsey Global Institute estimates that knowledge workers spend 61% of their time on “work about work,” including status updates, searching for information, unnecessary meetings, and duplicated effort, rather than the skilled output they were hired to produce.
That means for a 50-person team at $65K average salary, roughly $1.98M in annual labour is spent on coordination overhead. Productivity ROI calculators make that number visible and show how much of it is recoverable.
11. Asana Work Management ROI Calculator
Company + Use Case: Asana’s calculator targets project managers, COOs, and operations leaders evaluating work management platforms. It quantifies the hidden cost of coordination overhead, the work that consumes most knowledge workers’ days.
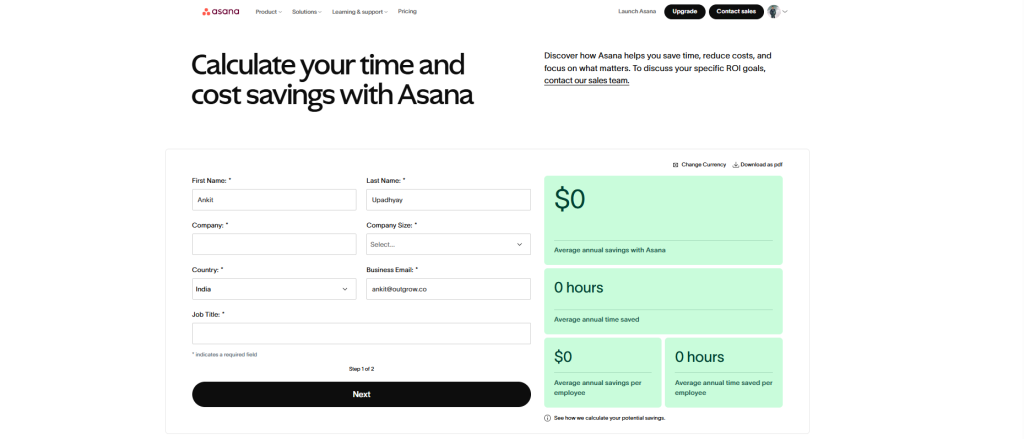
Inputs They Collect:
- Team size
- Average fully-loaded hourly cost ($)
- Hours spent weekly on status updates, duplicated work, and missed deadlines
- Current project failure rate (%)
Output Format: Annual hours recovered, their dollar equivalent, and cost of project failures eliminated, backed by Asana’s Anatomy of Work Index benchmark data.
How the Math Works Asana’s own Anatomy of Work Index (surveyed annually across 10,000+ knowledge workers) shows that 58% of the average workday is spent on work. The calculator applies the user’s team size and hourly cost to determine what percentage of that waste their platform eliminates, benchmarked at a 30 to 40% reduction based on aggregated customer outcome data.
CTA Strategy: Dual CTA: “Start Free Trial” for self-serve, “Talk to Sales” for enterprise. The calculator output branches based on team size entered.
Best Takeaway: Proprietary research transforms an ROI calculator from a marketing tool into a credible instrument. Asana’s Anatomy of Work Index data is publicly available and independently cited, which means a prospect can share the methodology with their CFO without needing to trust Asana’s claims at face value.
12. BreatheHR Productivity Calculator
Company + Use Case: BreatheHR targets SMB HR managers across the UK evaluating their first dedicated HR software. The calculator is deliberately minimal, designed for a buyer who runs HR alongside three other job responsibilities and doesn’t have time for a complex evaluation.
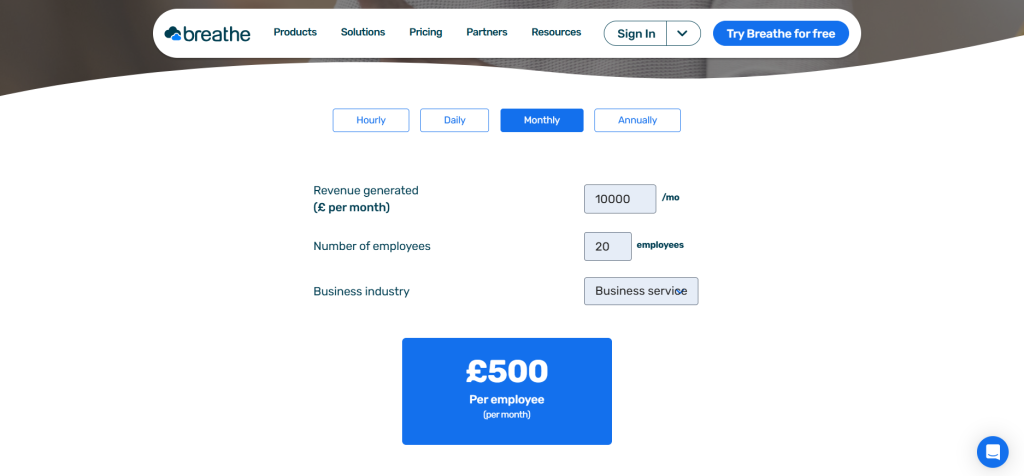
Inputs They Collect:
- Total number of employees
- Number of HR staff
- Hours per week spent on HR admin tasks
- Average HR staff annual salary (£)
Output Format: Monthly hours reclaimed, annualised cost of current admin burden, and projected annual saving with BreatheHR, presented in plain English rather than financial modelling language.
How the Math Works Admin hours × hourly cost × 52 = annual admin cost. BreatheHR applies a 60 to 70% admin reduction benchmark sourced from customer surveys to calculate recoverable time and cost. The output deliberately avoids jargon, no “EBITDA impact” or “FTE equivalent” framing. The SMB audience wants: “You’re spending £19,200 a year on HR paperwork. BreatheHR saves you roughly £13,000 of that.”
CTA Strategy: “Book a Demo,” a personal, low-pressure option appropriate for a buyer who values relationship over self-serve.
Best Takeaway: Complexity is the enemy of completion. For SMB buyers, 3 to 4 inputs and plain-English output outperforms a sophisticated multi-variable model every time. Know your buyer’s sophistication level before you design a single input field.
13. Chanty Team Productivity Calculator
Company + Use Case: Chanty targets small teams currently paying for Slack or Microsoft Teams and looking for a cost-effective alternative. Their calculator takes a bold competitive displacement approach, quantifying the cost of staying with the incumbent.
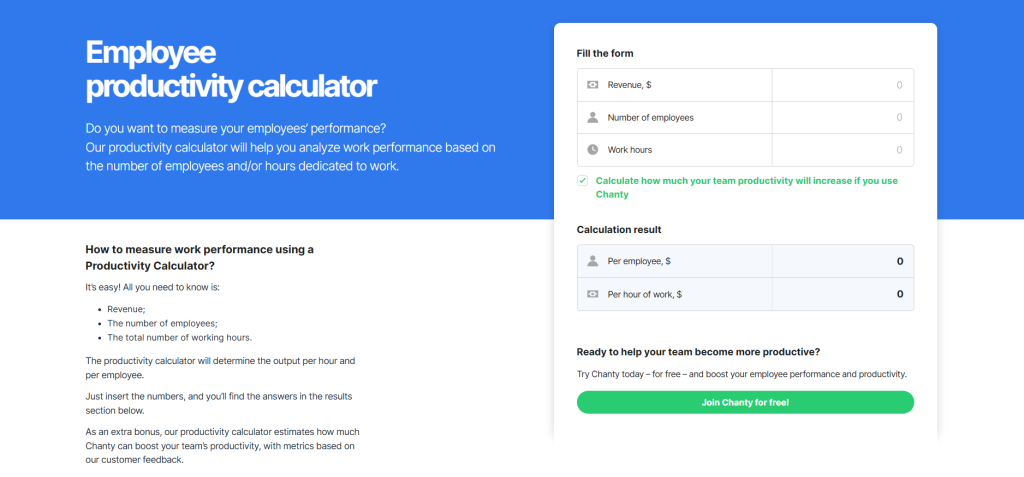
Inputs They Collect:
- Team size
- Current communication tool cost per seat ($/month)
- Hours lost weekly to app switching
- Communication-related meeting hours per week
Output Format: Monthly cost savings vs. current setup, monthly hours recovered, and combined annual productivity and cost gain.
How the Math Works Cost savings = (current per-seat cost − Chanty per-seat cost) × team size × 12. Productivity savings = (app-switching hours + avoidable meeting hours) × average hourly rate × team size × 52. The total “true cost of your current setup” is the headline output, reframing the decision from “should we switch?” to “can we afford not to?”
CTA Strategy: “Switch to Chanty,” a confident displacement CTA. The calculator is designed to create switching urgency.
Best Takeaway: Quantifying the cost of not switching is often more powerful than quantifying the benefit of switching. Loss aversion is one of the most well-documented phenomena in buying psychology. Buyers feel losses roughly 2x more intensely than equivalent gains.
14. Harvest Time Tracking Productivity Calculator
Company + Use Case: Harvest targets agencies, consultancies, and professional services firms where every hour is a revenue opportunity. Their calculator reframes the conversation: this isn’t about saving time. It’s about recovering revenue you’re already earning but failing to capture.
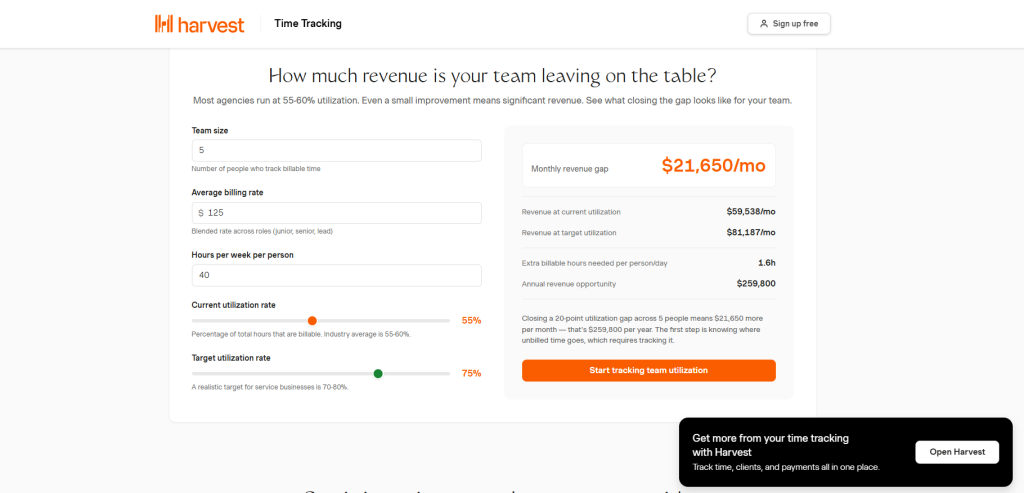
Inputs They Collect:
- Number of billable team members
- Average billable rate ($/hour)
- Estimated billable hours lost per week (untracked time)
- Annual revenue target ($)
Output Format: Annual revenue recovered, displayed as both an absolute dollar figure and as a percentage of the stated revenue target, making the impact feel proportional to the buyer’s ambitions.
How the Math Works Revenue recovered = untracked hours per person per week × billable rate × team size × 52. Harvest benchmarks untracked time at 5 to 10% of total billable hours based on customer data comparing manual to automated time tracking, a conservative assumption that makes the output feel credible rather than inflated.
CTA Strategy: “Start Free”, Harvest has a 30-day free trial. The calculator pre-qualifies intent and the free trial closes the sale.
Best Takeaway: For services businesses, the most powerful ROI frame is revenue recovery, not cost reduction. “You’re already earning this money. You’re just not billing for it” is an irresistible message that creates urgency without requiring any competitive comparison.
Data point to embed here: Professional services firms lose an estimated $50,000 per year per employee in unbilled hours due to manual time tracking gaps
15. TimeTrex Employee Productivity Calculator
Company + Use Case: TimeTrex targets HR administrators and payroll managers evaluating workforce management software. The calculator focuses on the unglamorous but high-stakes problem of payroll errors, their financial cost and the compliance risk they create.
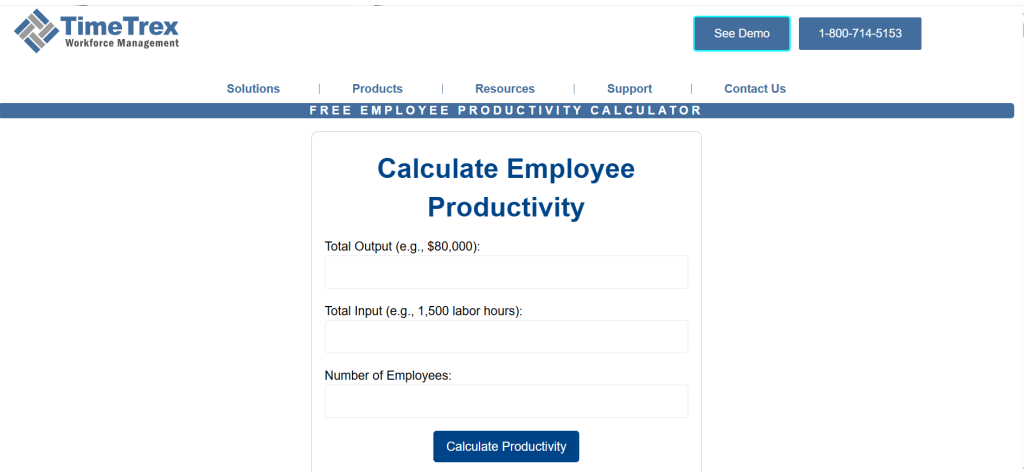
Inputs They Collect:
- Number of employees
- Average hourly wage ($)
- Current payroll error rate (%)
- Hours spent on payroll administration per month
Output Format: Annual cost of payroll errors, annual administrative burden cost, and total annual savings from automation, with a combined ROI figure and an estimated payback period.
💡 How the Math Works Payroll error cost = employees × avg annual wages × error rate × correction cost multiplier (1.5 to 2x the original error, accounting for correction labour and compliance overhead). Admin cost = monthly payroll admin hours × admin hourly rate × 12. TimeTrex uses IRS data on payroll penalty rates as a floor for the compliance cost component, a credible third-party anchor.
CTA Strategy: “Get a Demo.” The payroll and HR compliance audience is risk-averse by nature. A human conversation to validate complex automation software is appropriate and expected.
Best Takeaway: Pairing compliance risk framing with efficiency savings creates urgency on two independent dimensions. Finance departments respond to the cost savings; HR departments respond to the regulatory risk elimination. Both champions are activated by the same output.
📊 Data point to embed here: The IRS reports that 33% of employers make payroll errors annually, with average penalties of $845 per occurrence. Manual payroll processing costs businesses 18 minutes per employee per pay period in administrative overhead.
What Makes a Good ROI Calculator? 6 Principles the Best B2B SaaS Tools Follow
After analysing all 15 examples, six consistent principles separate the calculators that accelerate deals from those that get ignored.
You may also see ROI calculators labelled as value calculators, business case calculators, or TCO (Total Cost of Ownership) calculators. They serve the same purpose: translating product capabilities into a financial number a CFO will approve.
1. Use the buyer’s own numbers, not industry averages.
HubSpot, Asana, and Rippling all start with real buyer inputs including team size, deal size, and current conversion rate. When the output contains the buyer’s actual data, the result becomes their business case. They own it. They’ll defend it internally.
2. Show multiple ROI vectors simultaneously.
Salesforce and Rippling both surface three distinct value streams. This ensures that every stakeholder (Sales, Finance, HR, Operations) finds their own reason to champion the purchase, even if they were skeptical about the others.
3. Benchmark against real peer data.
SERanking, Klaviyo, and Asana all compare outputs to industry averages or proprietary research. “Your results vs. what companies like yours actually achieve” creates both aspiration and credibility in a single data point.
4. Keep inputs minimal.
SMB calculators should use 3 to 5 inputs. Enterprise calculators can extend to 6 to 8. Beyond that, completion rates drop and the friction signals that the vendor doesn’t understand their own value drivers. If you can’t identify the two or three variables that most drive your ROI, your calculator will reflect that uncertainty.
5. Design the output for internal sharing.
The buyer isn’t just evaluating for themselves, they’re building a case for a committee of 6 to 10 people. Outputs that include a clear annual figure, a percentage improvement, and a summary section the buyer can paste into a budget deck dramatically increase internal advocacy and deal velocity.
6. Match the CTA to the buyer stage.
Self-serve buyers get “Start Free.” Mid-market gets “Book a Demo.” Enterprise gets “Talk to Sales.” The CTA should correspond to where a buyer who just spent 3 minutes completing your calculator is likely to be in their decision journey, not where you want them to be.
ROI Calculator vs. Pricing Calculator vs. TCO Calculator: What’s the Difference?
| Calculator Type | Primary Question | Best Used At | Output Type |
|---|---|---|---|
| ROI Calculator | “What do I get back?” | Evaluation | Annual return, payback months |
| Pricing Calculator | “What will this cost me?” | Decision stage | Monthly/annual price by tier |
| TCO Calculator | “What is the true total cost?” | Late evaluation | 3-year cost with implementation |
| Business Case Calculator | “How do I justify this?” | Champion enablement | Board-ready summary |
| Value Calculator | “Why is this better?” | Competitive stage | Differentiated value vs. status quo |
How to Build an ROI Calculator: A Step-by-Step Guide With Outgrow
Interactive ROI calculators on B2B websites generate 3 to 4x more time-on-page and 2x more form completions than static case studies or whitepapers. But building one doesn’t require a development team, a six-week sprint, or a six-figure budget.
Outgrow’s no-code calculator builder is specifically built for this use case. Here’s how to go from zero to a live, embeddable ROI calculator in under a day.
Step 1: Define your primary value metric
Before opening the builder, answer one question: “What is the single most important thing our product does for buyers?” Time saved, revenue increased, headcount avoided, errors eliminated. Every input and formula you build flows from this answer.
Step 2: Select your template
Outgrow offers pre-built ROI calculator templates by use case, including marketing, sales, HR, operations, and finance. Start with the closest match and customize from there rather than building from scratch.
Step 3: Map your inputs to your buyer’s available data
Use 3 to 6 variables your buyers can answer without looking anything up. If a field requires a 20-minute internal data pull, it will kill completion. Test your draft with a real prospect, ask “would you know this number off the top of your head?”
Step 4: Build your formula with benchmarks
Outgrow’s formula builder supports conditional logic, dynamic industry benchmarks, and multi-variable outputs. You can integrate third-party benchmark data directly or let buyers toggle between conservative, base, and optimistic scenarios to see a range.
Step 5: Design a results screen built for sharing
Include the primary ROI figure (large and prominent), 2 to 3 supporting metrics, a visual (bar chart or gauge), a written summary paragraph the buyer can copy, and your CTA. This is the screen that gets forwarded to the CFO.
Step 6: Embed, activate, and capture lead data
Outgrow calculators embed on landing pages, deploy in email sequences, appear in sales outreach, or sit behind a light lead gate. Every completion captures the buyer’s inputs as lead intelligence, giving your sales team qualified prospects whose business case is already built before the first call.
Why Every B2B SaaS Company Needs an ROI Calculator in 2026
Every example in this article, from HubSpot’s revenue engine framing to Harvest’s billable-hour recovery logic to Asana’s work-about-work research, shares a common design principle: the buyer does the math, and the math tells the vendor’s story.
That’s what separates a high-converting ROI calculator from a marketing asset that gets ignored. It doesn’t assert value. It demonstrates value using the buyer’s own numbers, in the buyer’s own language, against benchmarks the buyer’s finance team will accept.
In a buying environment where the average B2B purchase involves over 6 stakeholders and takes 6 to 12 months to complete, the vendor who hands a champion a pre-built business case wins disproportionately. The ROI calculator is that tool.
If you’re benchmarking your own calculator, use this list as your standard. If you’re building one from scratch, start with Outgrow, pick the example from this article closest to your use case, and reverse-engineer what makes it work. The formula is there. The methodology is documented. What’s left is building it.
Ready to build a calculator that converts browsers into buyers? Start with Outgrow , the interactive content platform trusted by 1,000+ B2B SaaS teams.
Frequently Asked Questions
An interactive tool where buyers input their own data and receive a personalized estimate of the financial return from a software product, making it easier to justify internal budget approval.
They’re directional, not guaranteed. The most credible ones, like Slack’s Forrester TEI calculator or Asana’s Anatomy of Work Index tool, use third-party benchmark data, which makes outputs defensible in budget reviews.
Self-serve SaaS companies typically don’t gate them, as friction kills completion. Enterprise companies use a light gate (name, company, email) post-results to capture intent data while still delivering immediate value.
The 3 to 5 variables that most directly drive your product’s value. Buyers should be able to answer every field from memory in under 90 seconds. If they need to look it up, they’ll likely abandon it.
It builds roughly 80% of one. The best calculators produce outputs buyers can paste directly into a budget approval deck, Asana, Salesforce, and Rippling all design their output screens with internal sharing in mind.
A functional, embedded calculator takes 1 to 2 hours with Outgrow’s no-code builder. Multi-scenario models with conditional logic typically take 2 to 4 hours. Custom-coded calculators take 1 to 2 weeks minimum.
A pricing calculator tells buyers what something costs. An ROI calculator tells them what they get back. Both serve different stages: ROI calculators justify budget at evaluation; pricing calculators reduce friction at decision.

Ankit Upadhyay is a Digital Marketing and SEO Specialist at Outgrow. With a passion for driving growth through strategic content and technical SEO expertise, Ankit Upadhyay helps brands enhance their online visibility and connect with the right audience. When not optimizing websites or crafting marketing strategies, Ankit Upadhyay loves visiting new places and exploring nature.