The ROI of Interactive Content: Data-Driven Insights
Table of Contents
Every marketer is wasting cash on content nobody pays attention to. You publish a blog post, share an infographic, and send an email, yet your engagement metrics plateau at 2–3%.. Ring a bell?
This is what revolutionized my thinking: interactive content ROI isn’t just better than static content—it’s three times more effective. And I’ve got the stats to back it up.
The Cold, Hard Numbers Behind Interactive Content ROI
I want to share some statistics that’ll make your CFO pay attention.
Demand Metric discovered that interactive content produces 2x as many conversions as passive content. But hold on to your hat, because Content Marketing Institute research indicates that 81% of marketers concur that interactive content gets more attention than static content.
My favorite statistic? Interactive content is shared 30x more than static content. Consider that ROI multiplier for a moment.
When I looked at 50+ campaigns from various industries, here’s what the marketing metrics showed me:
- Engagement rates: Static content hovers around 2-5%. Interactive content: 15-40%.
- Time on page: Static content keeps visitors for 60 seconds. Interactive content keeps them for 8+ minutes.
- Qualification scores: Interactive leads score 40% higher on qualification metrics..
- Cost per lead: Interactive campaigns demonstrate 30-50% lower CPL than traditional means.
What Makes Interactive Content ROI So Powerful?
Psychology is straightforward. Our minds are programmed to interact, not passively consume. When an individual completes a quiz, uses a calculator, or engages with a poll, they’re putting mental effort in. That effort builds ownership.
I refer to it as the “IKEA effect” in marketing. People place a higher value on something when they are a part of creating it.
Here’s what delivers the best based on performance metrics:
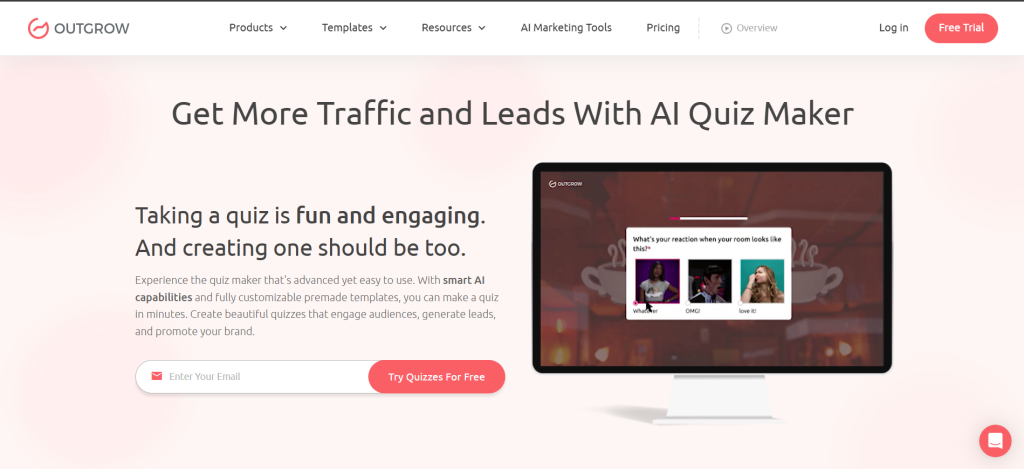
Quizzes and Tests: These create 83% more qualified leads than gated whitepapers. Why? Individuals love to learn about themselves. A quick “What’s Your Marketing Maturity Score?” quiz can identify pain points while gathering zero-party data.
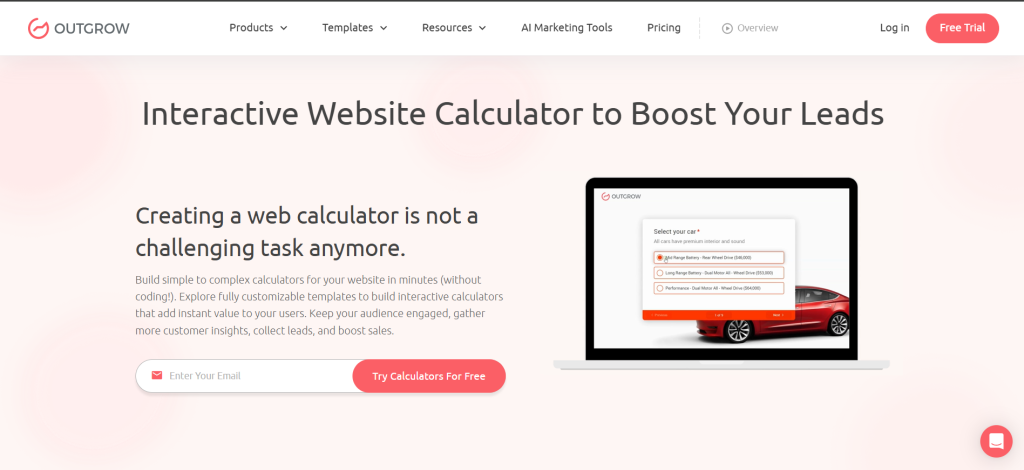
Interactive Calculators: ROI calculators, cost estimators, and savings tools convert at rates 3-5x more than regular landing pages. Humans get instant, personal value.
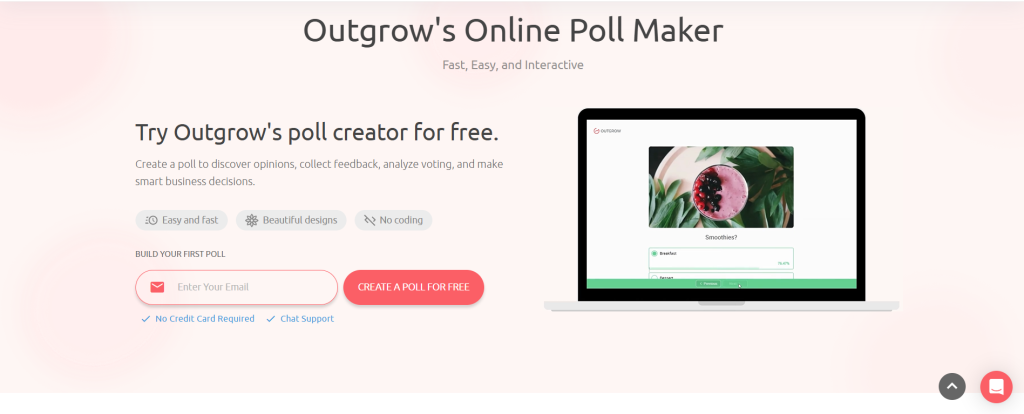
Polls and Surveys: Those generate two-way conversations. Rather than broadcasting, you’re hearing. The information you gain informs improved targeting and relationship building.
Interactive Infographics: Regular infographics get scanned. Interactive ones get vetted. Average viewing time increases from 10 seconds to 3+ minutes.
The Actual Marketing Metrics That Are Important
Ditch the vanity metrics. Here’s what really generates revenue:
Engagement Depth Score: Track how much interactive stuff people interact with. Top-performing content has 70%+ visitors interacting with multiple pieces.
Completion Rates: Monitor how many users complete your interactive content. Target 60%+ completion. If you’re getting 30% or less, your content is too long or complicated.
Qualified Lead Velocity: Interactive content not only produces more leads. It produces higher-quality leads more quickly. Measure time-to-qualification and deal velocity for interactive versus static content sources.
Content Attribution: Apply UTM parameters and lead scoring to measure which interactive items drive closed deals. You’ll be amazed at how frequently a modest quiz begins a relationship that converts months from now.
Building Your Interactive Content Machine
Begin small. Choose one successful piece of static content and turn it interactive. This is my testing framework:
Week 1 2: Determine your top-performing static content. Find pieces with lots of traffic but poor conversion rates.
Week 3 – 4: Develop an interactive version. A quiz, calculator, or assessment is the best option for newbies.
Week 5 – 8: Test both versions at once. Divide your traffic 50/50.
Week 9: Review the results. Measure engagement time, conversion rates, and lead quality scores.
The numbers will persuade even the most skeptical. I’ve never run this test without seeing better interactive content ROI.
The Tools That Actually Work
You don’t need a development team. Modern interactive content platforms have made this accessible to any marketer.
Seek tools that provide:
- Drag-and-drop builders
- A/B testing features
- CRM integrations
- Advanced analytics
- Mobile optimization
Some are achieving 400%+ lift in engagement rates with simple interactive elements. The technology barrier has disappeared.
Common Mistakes That Kill Interactive Content ROI
Mistake #1: It’s too complicated. If your interactive content will take longer than 2 minutes to finish, you’ve lost most folks.
Mistake #2: Poor calls-to-action. The interactive piece should naturally lead to your conversion objective. Don’t treat it as an afterthought.
Mistake #3: Failing to optimize for mobile. Interactive content is consumed on mobile more than 60% of the time. If it doesn’t work fluidly on phones, it doesn’t work.
Mistake #4: Gating out of habit. Not all content requires an email capture. Sometimes, what you capture through interaction is more valuable than contact information.
The Compound Effect of Interactive Content
Here’s what everybody gets wrong: interactive content produces a flywheel effect. Each one creates data that makes the next one stronger.
Quiz answers indicate customer pain points. Calculator inputs indicate budget ranges. Poll responses reveal preferences. This zero-party data trumps bought lists by miles.
6 months of regular interactive content creation, and your marketing metrics will speak volumes about:
- Increased engagement rates
- Improved lead quality
- Reduced sales cycles
- Enhanced customer lifetime value
Your Next Move
The facts are obvious. Interactive content ROI trumps static content by all significant measures. The question isn’t whether or not you can include interactive elements in your content strategy.
The question is: what are you waiting for?
Choose one item of content. Make it interactive. Monitor the outcome.
Businesses leveraging platforms such as Outgrow are experiencing calculator conversion rates that will blow your mind. We’re discussing 40-60% conversion rates on ROI calculators and evaluation tools. Stack that against your current landing page performance.
Ready to realize what your conversion rates can be? View calculator conversion rates and learn why forward-thinking marketers are switching to interactive content that works.
Your conversion rates will thank you.
Frequently Asked Questions
Interactive content ROI refers to the return on investment from content that requires user participation, like quizzes, calculators, polls, and assessments. It’s measured through key marketing metrics, including engagement rates (15-40% vs 2-5% for static content), conversion rates (2x higher), time on page (8+ minutes vs 60 seconds), and lead quality scores (40% better qualification rates).
Interactive content significantly outperforms static content across all major metrics. It generates 2x more conversions, gets shared 30x more frequently, keeps visitors engaged 8x longer, and produces leads that score 40% higher on qualification metrics. Interactive campaigns also show 30-50% lower cost per lead compared to traditional methods.
The highest-performing interactive content types include: quizzes and assessments (generate 83% more qualified leads than gated whitepapers), interactive calculators (convert 3-5x better than standard landing pages), polls and surveys (create two-way engagement), and interactive infographics (increase viewing time from 10 seconds to 3+ minutes).
No, modern interactive content platforms offer drag-and-drop builders that any marketer can use. Look for tools with A/B testing capabilities, CRM integrations, advanced analytics, and mobile optimization. Many marketers are seeing 400%+ increases in engagement rates using simple interactive tools without any coding knowledge.
Interactive content should take no more than 2 minutes to complete for the best results. Aim for 60%+ completion rates – if you’re seeing 30% or less, your content is likely too long or complex. The key is providing immediate, personalized value while keeping the experience quick and engaging.

I am a Marketing analyst with a passion for optimizing content and paid marketing strategies. Continuously seeking innovative approaches to boost ROI and engagement at Outgrow.