Conversion Rate Calculator: The Complete Guide to Measuring, Calculating & Improving Your Results
Table of Contents
You’re running ads. You’ve built a slick landing page. Traffic is flowing in. But here’s the question keeping you up at night, are those visitors actually converting? That’s exactly where a conversion rate calculator becomes your best business tool.
Whether you’re managing an ecommerce store, running a SaaS company, leading a sales team, or building lead generation funnels, knowing how to calculate conversion rate, and what to do with that number, is the difference between guessing and growing. And in 2025, with global ecommerce sales projected to hit $6.86 trillion, understanding your conversion rate KPI isn’t optional anymore. It’s survival.
In this guide, we break down everything you need to know, from the basic conversion rate calculation formula to advanced strategies for squeezing more value out of every visitor. Plus, we give you real data, industry benchmarks, and a look at how Outgrow’s interactive tools can help you optimize faster.
What Is a Conversion Rate? (And Why It Actually Matters)
Let’s start at the beginning, not because it’s basic, but because a lot of marketers get this subtly wrong in ways that quietly tank their metrics.
A conversion rate is the percentage of people who take a desired action out of the total number of people who had the opportunity to take it. That action could be anything, buying a product, signing up for a newsletter, booking a demo, downloading a whitepaper, or clicking a specific button.
The key word there is ‘desired.’ Your conversion is whatever you define it to be. That’s what makes the conversion rate such a flexible, powerful metric across industries, from retail and ecommerce to B2B sales and digital marketing.
Here’s a simple way to think about it: if 1,000 people visit your product page and 30 of them buy, your conversion rate is 3%. Sounds simple, right? It is, but most businesses aren’t doing the math consistently, let alone acting on it.
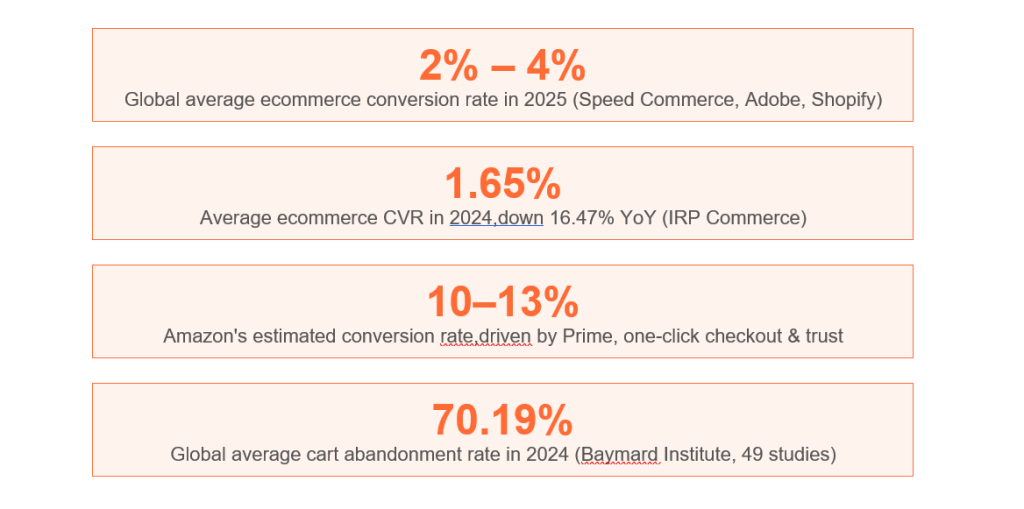
According to IRP Commerce data, the average ecommerce conversion rate dropped to 1.65% in 2024,a 16.47% decline from the previous year. That means businesses that aren’t actively monitoring and optimizing are quietly losing ground.
How to Calculate Conversion Rate, The Conversion Rate Calculation Formula
This is the foundation. Everything else builds on this.
Conversion Rate Formula: Conversion Rate (%) = (Number of Conversions ÷ Total Visitors or Leads) × 100
Let’s Walk Through Real Examples
Example 1, Ecommerce Conversion Rate Calculator: Your online store gets 15,000 visitors in a month. 285 of them complete a purchase. Your conversion rate = (285 ÷ 15,000) × 100 = 1.9%.
Example 2, Sales Conversion Rate Calculator: Your sales team contacts 500 leads in a quarter. 75 of them close as customers. Conversion rate = (75 ÷ 500) × 100 = 15%.
Example 3, Lead Conversion Rate Calculator: Your landing page gets 8,000 visits. 640 people fill out the lead capture form. Conversion rate = (640 ÷ 8,000) × 100 = 8%.
Example 4, Retail Conversion Rate Calculator: Your physical store had 2,500 foot traffic visitors last week. 420 of them made a purchase. Conversion rate = (420 ÷ 2,500) × 100 = 16.8%.
As you can see, the conversion rate calculation formula is the same across contexts, what changes is how you define ‘conversion’ and ‘total audience.’ That’s why using a dedicated website conversion rate calculator or an ecommerce conversion rate calculator can save time and reduce manual error, especially when you’re tracking multiple funnel stages at once.
Conversion Rate Calculator: How to Use One Effectively
A good online conversion calculator does more than just crunch numbers. When built right, like the interactive tools Outgrow creates, a conversion rate calculator marketing teams love is one that makes data actionable.
Here’s how a calculator conversion rate tool typically works and how to use it smartly:
Step 1: Define Your Conversion Event
Before you punch in any numbers, you need clarity on what counts as a conversion. This sounds obvious, but it’s where most teams get sloppy. A ‘conversion’ for your paid ads campaign might be a form fill. For your product page, it might be an add-to-cart action. For your email sequence, it might be a link click. These are all different KPIs.
Step 2: Pull Your Baseline Data
Grab your total visitors (or impressions, or leads, depending on your funnel stage) and the number of completed conversions for a specific time period. Consistency in your time period matters, comparing a 7-day window to a 30-day window gives misleading results.
Step 3: Use the Calculator, Then Segment
Run the numbers. Then run them again, segmented by traffic source, device type, geography, or audience demographic. A 3% overall conversion rate might look fine until you see that your mobile visitors are converting at 1.1% while desktop users hit 5.2%. That gap is your opportunity.
Step 4: Compare Against Benchmarks
A number in isolation means nothing. Your 2.3% conversion rate is excellent in one industry and mediocre in another. That’s why the next section matters so much.
What Is a Good Conversion Rate? Industry Benchmarks for 2025–2026
One of the most common questions marketers ask is: what is a good conversion rate? The honest answer is, it depends heavily on your industry, traffic source, device, and funnel stage. But here’s where the latest data lands:
Ecommerce Conversion Rate by Industry (2024–2025 Data)
| Industry / Category | Average Conversion Rate |
| Arts & Crafts | 5.11% |
| Food & Beverage | Up to 6.02% |
| Beauty & Makeup / Personal Care | 2.3% – 3%+ |
| General Apparel / Fashion | 2.2% |
| Electronics | 1.5% – 2% |
| Cars & Automobile Parts | ~2.1% |
| Home Décor & Furniture | 1.0% – 1.5% |
| Luxury Goods | Less than 1% |
| Baby & Child Products | 0.70% |
Conversion Rate Benchmarks by Traffic Source
Not all traffic is created equal. Your web conversion rate calculator will tell very different stories depending on where visitors came from:
- Organic search: ~4% conversion rate (highest intent traffic)
- Email marketing: 3–5% depending on list quality and segmentation
- Paid search (PPC): 2–3% (high competition, but strong intent)
- Direct traffic: 3–4% (existing customers and brand-aware visitors)
- Social media organic: 0.5–1.5% (browsing, not buying mindset)
- Display advertising: 0.1–0.5% (awareness stage, lowest conversion)
This is exactly why your conversion rate marketing calculator should segment by source, not just report an average. Rolling everything into one number can mask serious underperformance in specific channels.
Desktop vs. Mobile Conversion Rates
Mobile drives over 73% of ecommerce traffic globally in 2025, but desktop still converts at significantly higher rates in most industries. Why? Loading speed, screen real estate, and checkout complexity. If your mobile conversion rate is lagging 40–50% behind your desktop rate, you have an optimization problem worth fixing.
Website, Ecommerce, Sales & Lead Conversion Rate Breakdowns
Different contexts call for different ways to use a conversion rate calculator. Here’s how each major use case works in practice:
Website Conversion Rate Calculator
For a website, a conversion might mean anything from a page view to a demo request. Most marketing teams use a website conversion rate calculator to track macro conversions (purchases, sign-ups) and micro-conversions (video plays, scroll depth, CTA clicks) separately.
Benchmark: 2–5% is considered a healthy overall website conversion rate for most B2B companies. For B2C websites, 1–3% is typical, though top performers push significantly higher.
Ecommerce Conversion Rate Calculator
The ecommerce conversion rate calculator is probably the most widely used version. For Shopify store owners, the platform considers anything above 3% to be ‘among the very best-converting online stores.’ However, well-optimized Shopify Plus merchants regularly hit 4–5% and beyond.
Key variables to feed into your ecommerce conversion rate calculator:
- Sessions vs. unique visitors (don’t mix them)
- Conversion events (purchase only, or include add-to-cart?)
- Mobile vs. desktop separate tracking
- New visitors vs. returning visitors
Sales Conversion Rate Calculator
For sales teams, the conversion rate calculator sales leaders use measures how efficiently leads move through the pipeline. A typical B2B sales funnel might see a 10–20% lead-to-opportunity conversion and a 15–30% opportunity-to-close rate, depending on industry and deal size.
Formula: Sales Conversion Rate = (Closed Deals ÷ Total Leads Contacted) × 100
Lead Conversion Rate Calculator
Marketing teams obsess over traffic. But a lead conversion rate calculator shifts the focus to quality, not quantity. Landing page lead generation conversion rates vary enormously by industry:
- Legal services: 7–10%
- Finance & insurance: 5–8%
- Healthcare: 3–5%
- SaaS / Technology: 2–5%
- Education: 5–7%
Retail Conversion Rate Calculator
Physical retail is often overlooked in digital discussions, but the retail conversion rate calculator tells a very different story than online metrics. Foot traffic divided by actual purchasers can reveal whether store layout, staff training, or product placement is the bottleneck.
Brick-and-mortar retail typically sees 20–40% conversion rates, much higher than ecommerce, but with correspondingly higher overhead.
Key Factors That Impact Your Conversion Rate
Understanding the conversion rate calculation formula is step one. Understanding why your rate is what it is, and what levers you can pull, is where the real work happens.
Page Load Speed
Nitropack and Portent research consistently shows that a one-second delay in page load time reduces conversions by 7%. For mobile users, that number can jump even higher. If your website takes more than three seconds to load, you’re leaking conversions before visitors even see your offer.
Trust Signals
Reviews, security badges, social proof, and clear return policies directly correlate with conversion rates. PowerReviews data shows that products with reviews convert at significantly higher rates than those without. Brands integrating user-generated content (UGC) see up to 6x higher conversion rates.
Checkout Friction
Baymard Institute’s research across 49 studies found that 70.19% of shoppers abandon their carts. The primary culprits in the US? Unexpected shipping costs, tax fees, and complex checkout flows. Streamlining your checkout process alone can deliver measurable conversion rate increases.
Personalization
McKinsey research confirms that personalization is increasingly a make-or-break factor. In 2025, AI-driven email personalization lifted conversion rates by up to 20%. Amazon’s personalized recommendation engine is a big reason they maintain a 10–13% conversion rate that dwarfs industry averages.
Device Experience
Mobile drives the majority of traffic, but the conversion gap between mobile and desktop is real and often fixable. Simplified navigation, faster checkout, digital wallet support (Apple Pay, Google Pay), and thumb-friendly design all push mobile conversion rates upward.
Pricing Transparency
In the US, the top reason for cart abandonment is extra costs appearing at checkout. If your product costs $29 but the all-in price at checkout is $47 after shipping and fees, you’ve eroded trust and killed the conversion. Show pricing clearly and early.
How to Build Your Own Conversion Rate Calculator with Outgrow
Reading about conversion rates is great. Actually having a calculator on your website that computes them for your visitors in real time, that’s where the real magic happens. And that’s exactly what Outgrow lets you build, without writing a single line of code.
Below, we walk you through the exact Outgrow Conversion Rate Calculator template, what questions it asks, why each one matters, and what the output delivers. Whether you want to embed this on your site as a lead generation tool, share it with clients, or use it internally with your team, this template is ready to customize and launch in minutes.

STEP 1 Start with the Template
Go to Outgrow’s calculator template library and select the Conversion Rate Calculator template. You’ll get the full pre-built experience, all questions, logic, and result page, ready to customize. No coding required.
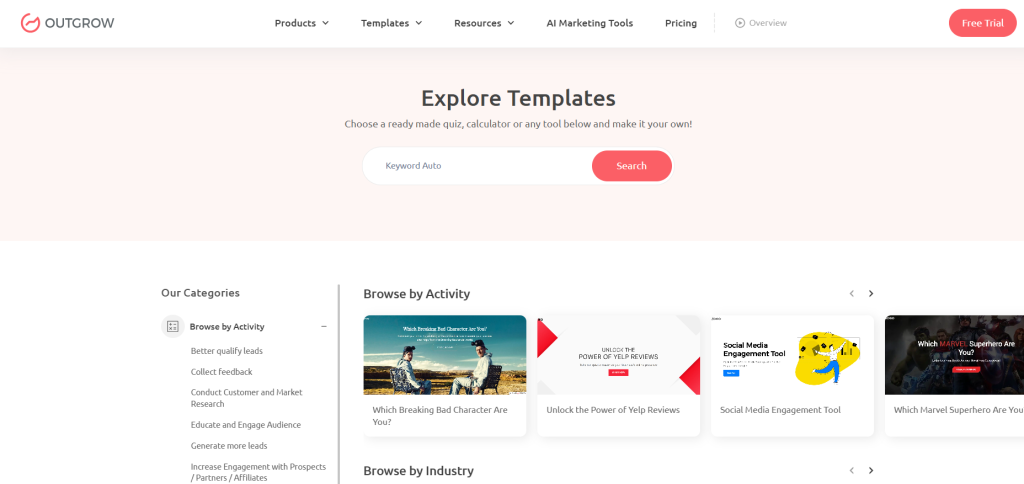
- Visit outgrow.co and log in or start a free trial
- Navigate to Templates > Calculators
- Select ‘Conversion Rate Calculator’ and click ‘Use This Template’
STEP 2 Customize the Branding & Questions
Outgrow’s visual editor lets you update every element of the calculator to match your brand identity. Change colors, fonts, logos, and button text in minutes. You can also modify or add questions to match your specific use case.
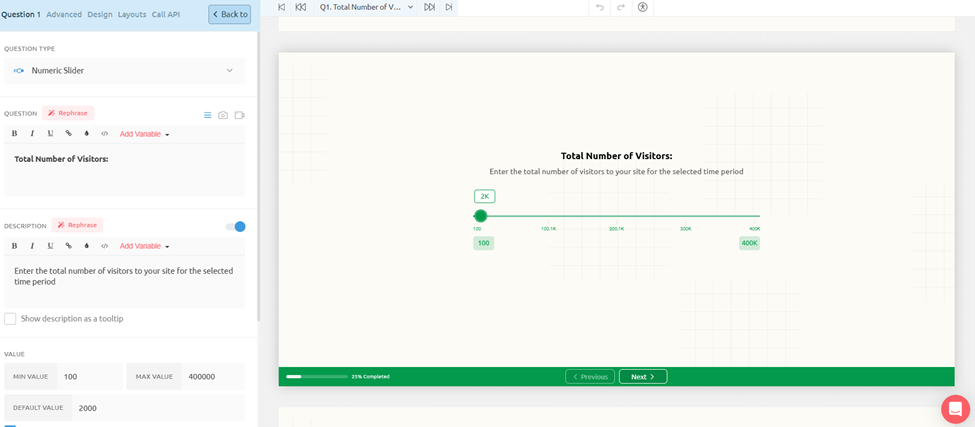
- Upload your logo and set your brand colors
- Edit the hero headline and subheadline copy
- Add industry-specific answer options (e.g., ‘SaaS Trial’ as a conversion type)
- Adjust the slider range if your traffic volumes are consistently high or low
- Add a lead capture form between the questions and results if you want to collect emails
STEP 3 Configure the Result Logic & Output
This is where the calculator gets smart. Outgrow lets you set up conditional result logic, so users who get a result below 1% see different recommendations than users hitting 4%+. Personalized outputs drive dramatically higher engagement and shareability.
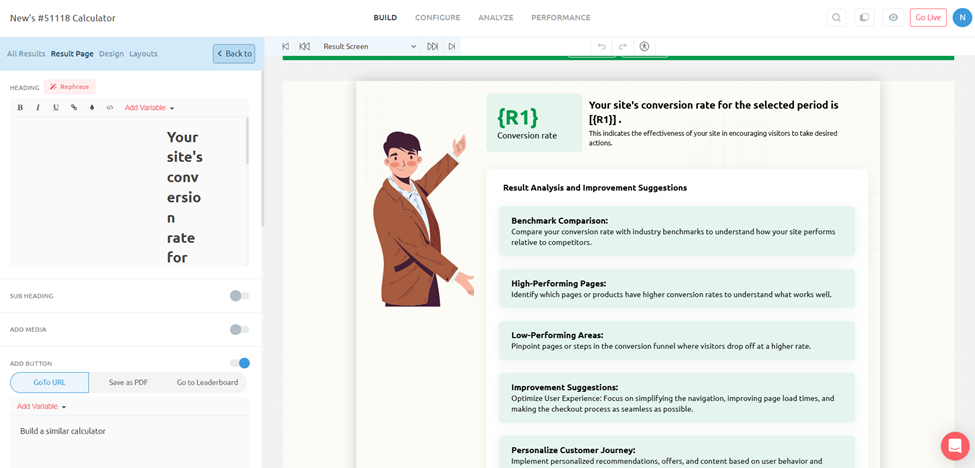
- Set result ranges (e.g., <1% = ‘Needs Urgent Attention’, 1–3% = ‘Average’, 3%+ = ‘Strong Performer’)
- Customize the recommendation copy for each range
- Add dynamic text that echoes the user’s inputs back in the result (e.g., ‘Based on your 15,000 monthly visitors…’)
- Include a benchmark comparison chart for visual impact
STEP 4 Add Lead Capture (Optional but Highly Recommended)
This is where the calculator becomes a lead generation machine. Outgrow lets you insert a lead capture gate, a simple email opt-in, between the last question and the results screen. Users who want to see their result enter their email first.
- Add a name + email form before the results page
- Write a short, value-focused prompt: ‘Where should we send your full conversion analysis?’
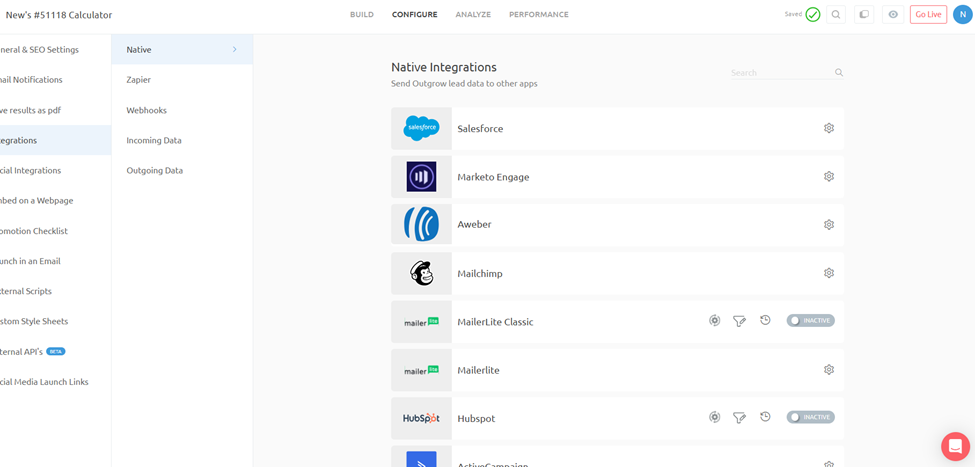
- Connect to your CRM: HubSpot, Salesforce, Mailchimp, Klaviyo, and 1000+ integrations supported
- Tag leads by their conversion rate result for personalized email follow-up
STEP 5 Embed, Share & Measure
Once your calculator is live, Outgrow gives you multiple ways to get it in front of the right audience, and built-in analytics to track exactly how it’s performing.
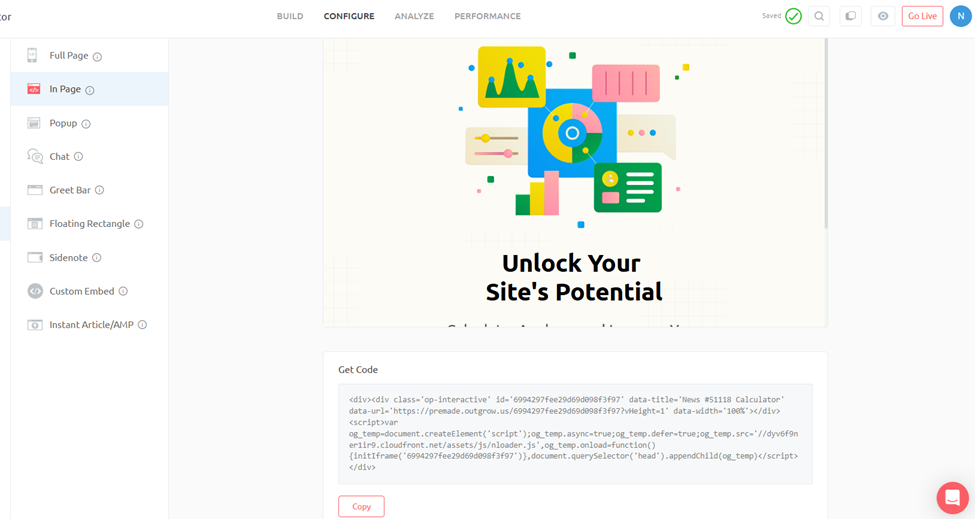
- Embed on any website page with a simple copy-paste code snippet
- Share as a standalone URL, works great for social, email, and paid ads
- Pop-up or slide-in trigger: show the calculator when visitors hit a pricing or product page
- Track completion rates, lead capture rates, and conversion rate results in Outgrow’s analytics dashboard
Why Building This Calculator Matters for YOUR Conversion Rate
Here’s the irony that’s too good not to mention: embedding a conversion rate calculator on your website actually improves your own conversion rate. Here’s why that’s not just a clever talking point, it’s backed by how interactive content works.
- Interactive content generates 2x more conversions than passive content (Demand Gen Report)
- Calculator users spend 3–5x longer on-site compared to blog readers
- Calculators on pricing or product pages have shown 30–40% higher conversion rates vs. static CTAs
- Lead capture rates through interactive tools average 20–40%,versus 1–5% for typical landing pages
When you put a conversion rate calculator on your website, especially on a pricing page, a results page, or embedded in a blog post like this one, you’re giving visitors a reason to stop scrolling and start engaging. That active participation shifts the psychology from passive browser to invested prospect. And invested prospects convert at dramatically higher rates.
The Outgrow template does this out of the box. You’re not just handing someone a formula, you’re giving them a personalized experience that makes them feel understood. That’s the difference between a visitor who bounces and a lead who converts.
What You Can Customize in the Outgrow Template
| What You Configure | Why It Matters |
| Hero Headline & Subheadline | Match your brand voice and speak directly to your target audience (e.g., ‘For Shopify Store Owners’) |
| Slider Range (Visitors) | Adjust min/max to fit your typical user, a local retailer needs different ranges than an enterprise SaaS |
| Time Period Options | Add or remove time periods to match your reporting cadence (e.g., add ‘Annual’ for executive reporting) |
| Conversion Type Choices | Replace or expand the Purchases/Signups/Downloads options with your specific conversion events |
| Result Ranges & Copy | Define what ‘good’ and ‘needs work’ looks like for your specific industry vertical |
| Recommendation Content | Tailor the analysis tips to your product’s features and your audience’s real pain points |
| Lead Capture Form | Add, remove, or reposition the email capture gate; customize form fields and incentive copy |
| Brand Colors & Logo | Full white-label, looks like your product, not Outgrow’s |
| CRM & Email Integration | Connect HubSpot, Salesforce, Mailchimp, Klaviyo, ActiveCampaign, Marketo, and 1,000+ others |
| Embed Style | Inline, pop-up, slide-in, or full-page, deploy wherever it makes the most sense in your funnel |
How to Improve Your Conversion Rate (Practical Tactics That Work)
Data tells you what’s happening. Strategy tells you what to do about it. Here’s what actually moves the needle in 2025:
Run Structured A/B Tests
A/B testing is the most reliable way to improve conversion rates because it removes guesswork. Test one variable at a time, headline copy, CTA button color, form length, hero image, and let your conversion rate marketing calculator tell you which variation wins. Small, consistent gains compound over time.
Use Interactive Content and Calculators
Here’s where Outgrow has a serious edge. Interactive content, quizzes, assessments, calculators, recommendation engines, consistently outperforms static content in generating leads and driving conversions. A well-built calculator conversion rate tool on your website does three things simultaneously: it engages the visitor, qualifies them, and delivers personalized value. That combination drives conversion rates far above what typical landing pages achieve.
Think about it: a generic landing page tells visitors why your product is great. An interactive calculator shows them exactly what they’ll save, earn, or gain. That shift from telling to showing is conversion-rate gold.
Optimize for Mobile-First Experience
With over 73% of ecommerce traffic coming from mobile devices, a mobile-first optimization strategy isn’t optional anymore. Prioritize thumb-zone design, single-field forms, auto-fill support, and digital wallet integration. Brands that nail mobile UX regularly see 20–30% improvement in mobile conversion rates.
Reduce Cognitive Load
Too many choices, too much text, and too many CTAs all kill conversions. The principle is simple: every element on your page should either support the conversion or be removed. Clean design, focused messaging, and a single clear call-to-action outperform busy pages almost every time.
Use Exit-Intent Strategies
Exit-intent popups, when done right, can recover 3–5% of abandoning visitors. The key is relevance, offer something genuinely valuable (a discount, a resource, a free trial extension) at the exact moment someone is about to leave.
Leverage Social Proof Strategically
Testimonials, case studies, review counts, and trust badges work best when they’re specific and placed near points of friction (like your pricing section or checkout). Vague social proof (‘Trusted by thousands!’) underperforms specific proof (‘4.9/5 stars from 12,847 verified buyers’).
Personalize at Scale with AI
In 2025, personalization tools have become accessible even to small businesses. Whether you’re using dynamic email content, behavioral targeting on your website, or AI-driven product recommendations, personalized experiences consistently outperform generic ones, often by 10–25% in conversion rate improvement.
Conversion Rate KPIs You Should Be Tracking
Your conversion rate doesn’t exist in isolation. It’s one signal in a broader constellation of metrics. Here are the conversion rate KPIs that savvy marketers track together:
- Overall Conversion Rate – Your headline metric from the conversion rate calculation formula
- Micro-Conversion Rates – Individual funnel stages (email open → click → sign-up → purchase)
- Traffic Source Conversion Rate – How each channel performs using your marketing conversion rate calculator
- Device Conversion Rate – Mobile vs. desktop vs. tablet segmentation
- Landing Page Conversion Rate – Per-page performance to identify your highest and lowest performers
- Lead-to-Customer Rate – Bottom-of-funnel metric especially relevant for B2B sales
- Cart Abandonment Rate – Inverse of checkout completion; targets the 70% who don’t finish
- Repeat Customer Conversion Rate – How often existing customers return to purchase again
- Form Completion Rate – Particularly important for lead generation businesses
When you use a calculator conversion rate tool that tracks all of these together, you get a full picture of funnel health rather than a single number that could be masking problems at specific stages.
Cost Per Conversion Calculator, Connecting Your Spend to Results
Here’s where conversion rate data gets directly connected to your budget decisions. A cost per conversion calculator answers the question: ‘How much are we paying for each successful outcome?’
Cost Per Conversion Formula: Cost Per Conversion = Total Campaign Spend ÷ Number of Conversions
Example: You spent $5,000 on a Google Ads campaign. It generated 120 conversions. Your cost per conversion = $5,000 ÷ 120 = $41.67 per conversion.
This metric pairs powerfully with your conversion rate data. If you know your average order value is $150 and your cost per conversion is $41.67, you’re running a profitable campaign. If your cost per conversion is $175, you have a problem that no amount of traffic will solve.
IRP Commerce data from 2024 shows that as the average ecommerce conversion rate dropped by 16.47%, the average cost per acquisition (CPA) rose by 5.33% to 9.34%. That relationship is direct, lower conversion rates mean higher acquisition costs for every business running paid channels.
This is exactly why investing in conversion rate optimization pays dividends: every improvement in your conversion rate directly reduces your cost per conversion without requiring additional ad spend.
Conversion Rate Calculator Google & Tool Integrations
When people search for a ‘conversion rate calculator Google’ tool, they’re typically looking for either Google Analytics-native tracking or third-party tools that integrate with Google’s ecosystem. Here’s a quick breakdown of what works and when:
Google Analytics 4 (GA4)
GA4’s conversion tracking is built around ‘events’ rather than goals. You define what counts as a conversion event (purchase, form submit, page view duration, etc.), and GA4 tracks the rate automatically. The built-in reporting shows your conversion rate by traffic source, device, and audience segment.
Google Ads Conversion Tracking
For paid search, Google Ads provides its own conversion rate tracking that integrates with your ad campaigns. This gives you a direct line between ad spend, clicks, and conversions, essentially a built-in conversion rate calculator sales and marketing teams can act on in real time.
Outgrow Calculator Tools
This is where things get interesting. Outgrow’s interactive calculators don’t just measure conversions, they actively drive them. A well-designed ROI calculator, savings estimator, or pricing calculator embedded in your site gives visitors a personalized value demonstration that static pages simply can’t match. These tools can push conversion rates 2–3x above industry averages for comparable traffic.
CRM Integrations
For sales-focused teams, connecting your CRM (Salesforce, HubSpot, Pipedrive) with your conversion tracking gives you the full picture from first touch to closed deal, making your sales conversion rate calculator actually useful across the entire revenue pipeline.
Metric Conversion Rates & Conversion Factor Calculator – A Quick Note
It’s worth acknowledging that not every search for ‘conversion rate calculator’ is about marketing. Metric conversion rates and conversion factor calculators are used in scientific, engineering, and everyday measurement contexts, converting kilometers to miles, Celsius to Fahrenheit, liters to gallons.
While that’s a completely different application, the underlying math is analogous: you’re taking a known value and applying a standardized ratio to express it in different terms. The same principle of ‘ratio-based calculation’ applies whether you’re converting measurement units or marketing conversion rates.
For business and marketing contexts, though, the conversion rate calculator you need is the one that tells you how your funnel is performing, and that’s what the rest of this guide is focused on.
Recent Research, Stats & Data Worth Bookmarking
Let’s consolidate the key numbers from 2024–2025 research that should inform your conversion rate benchmarking:
Global Ecommerce Conversion Rate Data
- Global average ecommerce conversion rate in 2024: 1.65% (IRP Commerce) to 1.89% (IRP broader dataset)
- Average range for 2025 across studies: 2%–4% (Speed Commerce, Adobe, Shopify)
- Top performers (Shopify Plus, optimized stores): 4–5%+ consistently
- Amazon conversion rate: estimated 10–13%, boosted by Prime membership and one-click checkout
- BFCM 2023 saw conversion rates surge to 6.4%, nearly triple the annual average
Mobile & Device Statistics
- Mobile devices account for 73% of global ecommerce traffic in 2025
- Mobile holds 60.9% of conversion share (2024 data) despite lower per-session conversion rates
- Desktop conversion rates remain higher per session due to better UX and purchase intent
- 53% of shoppers worldwide used a digital wallet in 2024
Cart Abandonment
- 70.19% global average cart abandonment rate (Baymard Institute, analysis of 49 studies)
- Top reason for US cart abandonment: unexpected extra costs at checkout (shipping, tax, fees)
- Exit-intent optimization can recover 3–5% of abandoning visitors
Personalization & Social Proof Impact
- Brands integrating UGC (user-generated content) see up to 6x higher conversion rates
- AI-driven email personalization lifted conversion rates by ~20% in 2025
- Cross-selling can drive 10–30% of ecommerce revenue when implemented effectively
- Social commerce is projected to reach $2.9 trillion globally by 2026
Industry & Regional Benchmarks
- Americas region leads global ecommerce conversion at 3.14% (2025 data)
- Food & Beverage leads by category at up to 6.02% conversion rate
- Arts & Crafts: 5.11% average, the highest of measured retail categories
- Luxury goods and furniture: consistently under 1.5% due to longer purchase cycles
- U.S. ecommerce buyer base: 288.45 million consumers contributing to $1.26 trillion in projected 2025 sales
How Outgrow’s Conversion Rate Tools Give You an Edge
Reading about conversion rate optimization is one thing. Actually building tools that move the needle is another. This is where Outgrow’s interactive content platform becomes genuinely powerful.
Outgrow lets you build custom calculators, quizzes, assessments, and recommendation engines, without coding. These interactive tools can be embedded anywhere in your funnel and they do something static content can’t: they deliver personalized, dynamic value to each individual visitor.
Think about the difference between:
Static landing page: ‘Our product saves businesses up to 40% on operational costs.’
Interactive Outgrow calculator: ‘Based on your company size and current workflow, you could save $47,320 per year with our platform.’
That second experience is personalized, specific, and immediately relevant. It answers the visitor’s real question (‘What’s in it for me, specifically?’) in a way that generic copy never can. And when a visitor engages with a calculator or quiz, they’re not just passively reading, they’re investing time and sharing information. That shift in behavior directly drives higher conversion rates.
Whether you’re building a website conversion rate calculator for your own marketing stack, or creating lead generation tools for clients, Outgrow’s platform gives you the infrastructure to do it quickly and measure the results precisely.
Pro Tip: Interactive calculators placed on high-intent pages (pricing pages, ROI pages, comparison pages) consistently outperform standard CTAs. They give hesitant visitors a concrete, personalized reason to act,rather than a generic push to ‘Get Started.’
The Bottom Line: Your Conversion Rate Is a Lever, Not Just a Number
A conversion rate calculator is more than a formula, it’s a diagnostic tool that reveals the health of your entire marketing and sales operation. Whether you’re using it to benchmark your ecommerce conversion rate, evaluate your sales pipeline efficiency, or justify ad spend to stakeholders, the numbers only become valuable when you act on them.
The data is clear: global competition is intensifying, attention spans are shrinking, and customers have more options than ever. The businesses that win are the ones that obsess over the quality of every interaction, not just the volume of traffic.
Start with the formula. Build the habit of calculating regularly. Segment your data. And then look at how interactive tools, personalization, and friction reduction can systematically move your numbers upward. A 1% improvement in conversion rate doesn’t sound like much, until you do the math on what it means for your revenue.
Ready to build your own conversion rate calculator or interactive lead generation tool? Outgrow makes it easy, no code required. Build calculators, quizzes, assessments, and recommendation engines that convert visitors into qualified leads and customers.
Frequently Asked Questions (FAQs)
Generally, 2–5% is solid. Top-performing pages hit 10%+. Compare against your specific industry benchmarks for accurate assessment.
Divide conversions by total visitors, then multiply by 100. Example: 50 sales ÷ 2,000 visitors × 100 = 2.5% conversion rate.
Between 2% and 4% globally, with top-performing stores reaching 4–5%+. The 2024 IRP Commerce average was 1.65%.
A conversion rate KPI measures how efficiently your funnel turns visitors into desired actions, purchases, leads, sign-ups, or demos.
Divide total campaign spend by total conversions. Lower cost per conversion means more efficient marketing spend and better ROI.
Common causes: slower page speed, increased competition, poor mobile experience, checkout friction, or misaligned traffic sources.
Lead conversion rate measures form fills or opt-ins from visitors. Sales conversion rate measures actual closed deals from leads contacted.
They deliver personalized value instantly, engaging visitors actively and giving them specific reasons to act based on their unique situation.
GA4 tracks conversions natively. Combine it with Outgrow interactive tools for both measurement and active conversion rate improvement.
Weekly for active campaigns. Monthly for overall funnel health. Always after major site changes or traffic source shifts.

Ankit Upadhyay is a Digital Marketing and SEO Specialist at Outgrow. With a passion for driving growth through strategic content and technical SEO expertise, Ankit Upadhyay helps brands enhance their online visibility and connect with the right audience. When not optimizing websites or crafting marketing strategies, Ankit Upadhyay loves visiting new places and exploring nature.
![4 Best eCommerce Personalization Software [+Free Templates]](https://outgrow.co/blog/wp-content/uploads/2023/05/Blogs-min-1536x768-1-1-1.png)