The Complete Guide to Ranking Surveys: Master Survey Ranking Questions & Drive Better Decisions in 2025
Understanding customer preferences isn’t just about collecting data, it’s about uncovering what truly matters to your audience. Ranking surveys have emerged as one of the most powerful tools in market research, helping businesses make data-driven decisions backed by clear priorities. With the global market research industry reaching $140 billion in 2024, and 85% of professionals regularly using online surveys, mastering ranking survey questions has become essential for staying competitive.
In this comprehensive guide, you’ll discover everything about ranking surveys: from creating effective ranking survey questions to choosing the best free survey ranking tool, understanding forced ranking surveys, and implementing best practices that drive actionable insights.
What is a Ranking Survey? Understanding the Fundamentals
Table of Contents
A ranking survey is a specialized research method that asks respondents to order a list of options based on specific criteria, such as preference, importance, or priority. Unlike rating scales where respondents evaluate each item independently, ranking surveys force meaningful choices that reveal true priorities.
How Ranking Survey Questions Work
Ranking survey questions present respondents with multiple options and ask them to arrange these items in a specific order. The methodology captures relative preferences rather than absolute values, providing deeper insights into decision-making patterns.
Key characteristics of ranking surveys include:
- Comparative analysis: Items are evaluated relative to each other, not in isolation
- Forced prioritization: Respondents must make trade-offs between options
- Ordinal data collection: Results show ranked order rather than interval measurements
- Decision-making insights: Reveals how people actually choose when faced with limited resources
Ranking Survey vs. Rating Survey: Understanding the Critical Difference
Many researchers confuse these two methodologies, but the distinction is crucial for collecting accurate data:
Rating Surveys ask respondents to evaluate each item on a common scale (e.g., 1-10 or “strongly disagree” to “strongly agree”). Every item receives an independent score.
Example: Rate each restaurant feature from 1-5
- Food quality: 5
- Service speed: 5
- Ambiance: 5
- Price: 5
Ranking Surveys force respondents to order items by preference, creating a hierarchy where one item’s position affects others.
Example: Rank these restaurant features from most to least important
- Food quality
- Price
- Service speed
- Ambiance
As market research experts note, while someone might rate all dessert options as “liked” on a rating scale, they’ll ultimately choose their single favorite when ranking, revealing their true preference.
Types of Ranking Survey Questions You Need to Know
Understanding different ranking question formats helps you select the optimal approach for your research goals.
1. Drag-and-Drop Ranking Questions
The most intuitive format where respondents physically arrange items by dragging them into preferred order. This method is particularly effective for desktop users and provides a seamless experience.
Best for: Product feature prioritization, user experience studies, preference mapping
2. Click Ranking Questions (Radio Button Matrix)
Respondents select a ranking for each option from a list of provided rankings. This format works well across all devices, especially mobile.
Best for: Mobile-first surveys, complex attribute evaluations, large-scale studies
3. Forced Ranking Survey Questions
Respondents must rank all items without the option to skip or mark items as “not applicable.” This creates complete datasets but requires careful implementation.
Best for: Strategic decision-making, budget allocation, resource prioritization
4. Top-N Ranking Questions
Instead of ranking all items, respondents only rank their top 3-5 choices. This reduces cognitive load while capturing the most critical preferences.
Best for: Long item lists (10+ options), consumer preference studies, feature requests
5. Pairwise Comparison (Best-Worst Scaling)
Respondents choose between two items at a time. After multiple comparisons, an overall ranking emerges. This method, also known as MaxDiff, reduces bias and increases reliability.
Best for: Brand positioning, pricing research, attribute importance studies
6. Points Allocation Ranking
Respondents distribute a fixed number of points across items, revealing both ranking and intensity of preference.
Best for: Budget allocation decisions, resource planning, investment prioritization
How to Create a Ranking Survey in Outgrow (Step-by-Step)
Creating a ranking survey in Outgrow is intuitive and powerful, offering features that basic form builders can’t match. Here’s your complete guide to building high-converting ranking surveys:
Step 1: Choose Your Survey Template
- Log into your Outgrow dashboard
- Click “Create New” and select “Survey” or “Quiz”
- Browse ranking survey templates or start from scratch
- Select a template that matches your goal (feature prioritization, customer feedback, market research)
Pro Tip: Outgrow offers industry-specific templates that come pre-optimized for maximum completion rates.
Step 2: Add Ranking Questions
- Click “Add Question” in your survey builder
- Select “Ranking Question” from the question type menu
- Enter your question text (e.g., “Rank these features by importance to you”)
- Add your ranking items (5-7 items recommended for best results)
- Choose ranking format:
- Drag-and-drop: Most intuitive for desktop users
- Click-to-rank: Optimized for mobile devices
- Top-N ranking: Let respondents rank only their top 3-5 choices
Step 3: Customize Your Survey Design
- Apply your brand colors, fonts, and logo
- Add compelling visuals or icons to each ranking item
- Customize button text and progress indicators
- Set up conditional logic (show different questions based on rankings)
- Enable/disable features like progress bar, back button, or result sharing
Outgrow Advantage: Your survey automatically adapts to any device, ensuring perfect mobile experience without extra configuration.
Step 4: Configure Analytics & Integrations
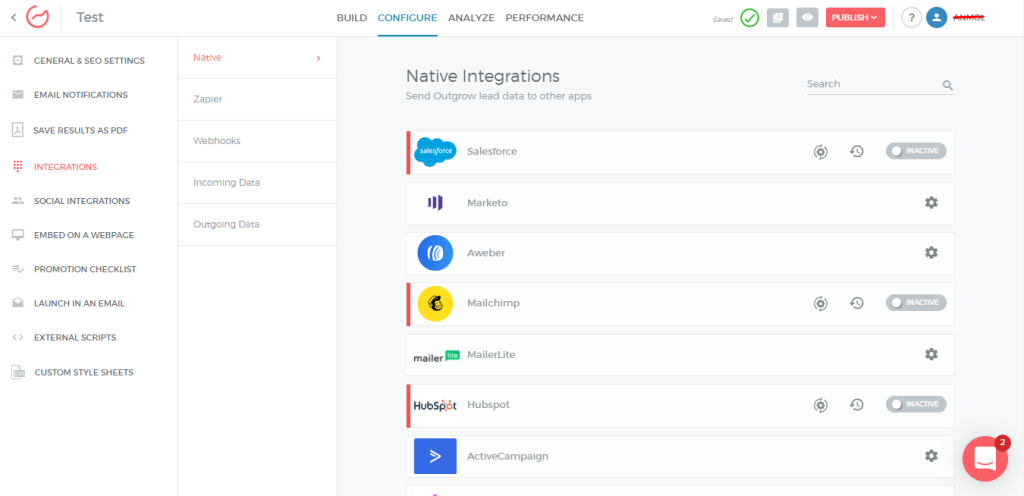
- Navigate to “Settings” > “Integrations”
- Connect your CRM (Salesforce, HubSpot, Pipedrive, etc.)
- Set up lead scoring rules based on ranking responses
- Configure automated email notifications for specific ranking patterns
- Enable real-time analytics dashboard
Advanced Feature: Set up segment-based reporting to automatically compare rankings across customer types, demographics, or behavioral groups.
Stage 5: Set Up Lead Capture
- Add a lead capture form before or after ranking questions
- Choose which fields to collect (name, email, company, etc.)
- Configure progressive profiling to avoid asking for data you already have
- Set up GDPR-compliant consent checkboxes
- Create personalized thank-you messages based on rankings
Stage 6: Preview & Test
- Click “Preview” to test your survey on desktop, tablet, and mobile
- Complete the survey yourself to verify logic flows
- Check that rankings are recorded correctly in analytics
- Test integration with your CRM to ensure data flows properly
- Share preview link with team members for feedback
Step 7: Publish & Distribute
- Click “Publish” when ready
- Choose distribution method:
- Embed on website: Copy embed code for your site
- Share direct link: Get shareable URL for email or social media
- Pop-up: Set triggers for when survey appears on your site
- Chatbot integration: Include in conversational flows
- Set up tracking parameters for campaign attribution
- Launch and monitor results in real-time
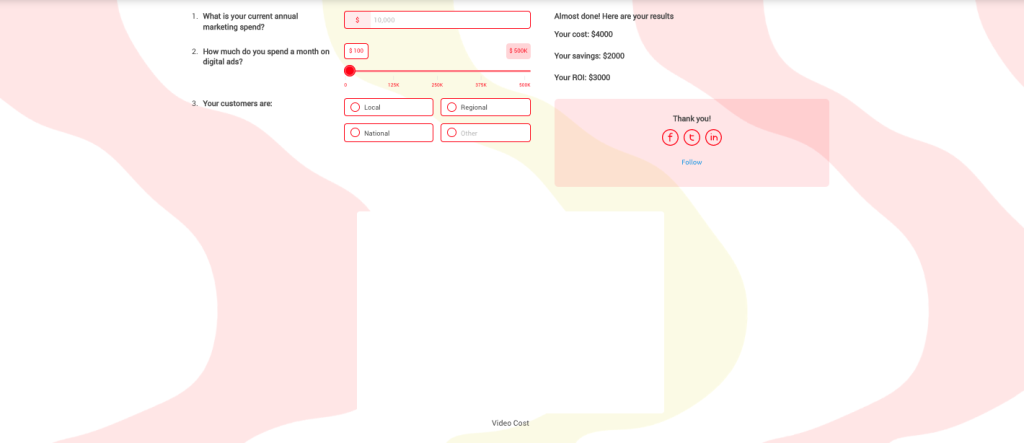
Step 8: Analyze Results
Access Outgrow’s analytics dashboard to:
- View weighted mean rankings automatically calculated
- See first-place vote counts for each item
- Compare rankings across segments (industry, company size, etc.)
- Export data to Excel or CSV for deeper analysis
- Generate visual reports to share with stakeholders
Why Outgrow Beats Traditional Form Builders:
- ✓ Native drag-and-drop ranking (not makeshift workarounds)
- ✓ Mobile-first design with 40%+ higher completion rates
- ✓ Built-in CRM integrations (no Zapier needed)
- ✓ Advanced conditional logic and branching
- ✓ Real-time analytics with automatic calculations
- ✓ Lead scoring based on ranking responses
- ✓ Beautiful, branded experiences that build trust
- ✓ A/B testing capabilities to optimize performance
Best Free Ranking Survey Tools (2025 Comparison)
Choosing the right free survey ranking tool can dramatically impact response rates and data quality. Here’s a comprehensive comparison with Outgrow leading the pack:
Outgrow (Best Overall for Business Growth)
Pricing: Free trial available, paid plans start at affordable rates
Features:
- ✓ Native drag-and-drop ranking with intuitive interface
- ✓ Mobile-first design with 40%+ higher completion rates
- ✓ Direct CRM integrations (Salesforce, HubSpot, Marketo, Pipedrive)
- ✓ Advanced conditional logic and branching
- ✓ Real-time analytics with automatic weighted calculations
- ✓ Lead scoring based on ranking responses
- ✓ A/B testing to optimize performance
- ✓ No-code builder with 1000+ templates
- ✓ Brand customization with white-label options
- ✓ Embed anywhere (website, pop-up, chatbot, email)
- ✓ GDPR compliant with built-in consent management
- ✓ Professional reporting with exportable visualizations
Why Outgrow Wins: Unlike generic form builders, Outgrow is purpose-built for lead generation and conversion. Your ranking surveys don’t just collect data, they qualify leads, integrate with your sales process, and provide actionable insights in real-time. The platform combines beautiful UX with powerful marketing automation.
Best for: Businesses serious about converting survey responses into revenue, marketing teams needing CRM integration, companies wanting professional-grade surveys without developer resources
User Rating: 4.7/5 (G2 Reviews)
OpinionX (Best for Dedicated Ranking Research)
Pricing: Free tier with unlimited surveys and participants
Features:
- Multiple ranking formats (pairwise, order rank, points allocation)
- Segmentation analysis
- No participant limits
- Image ranking capabilities
- Branching logic
Best for: Teams needing specialized ranking research without budget constraints
SurveyKing (Best for Flexibility)
Pricing: Free template available
Features:
- Click and drag-and-drop ranking options
- Top-N ranking (rank only top 3 or 5)
- Segment reporting
- Mobile-responsive design
- Excel export
Best for: Researchers who want flexibility to rank all items or only top choices
Jotform (Best for Customization)
Pricing: Free tier available
Features:
- Orderable list widget
- 10,000+ templates
- Conditional logic
- Offline data collection
- Brand customization
Best for: Organizations needing highly customized survey experiences
Typeform (Best for User Experience)

Pricing: 10 respondents per month on free tier
Features:
- Beautiful, conversational interface
- Mobile-first design
- Logic jumps
- Ranking questions available
Best for: Small-scale projects prioritizing respondent experience
Google Forms (Best for Simple Projects)
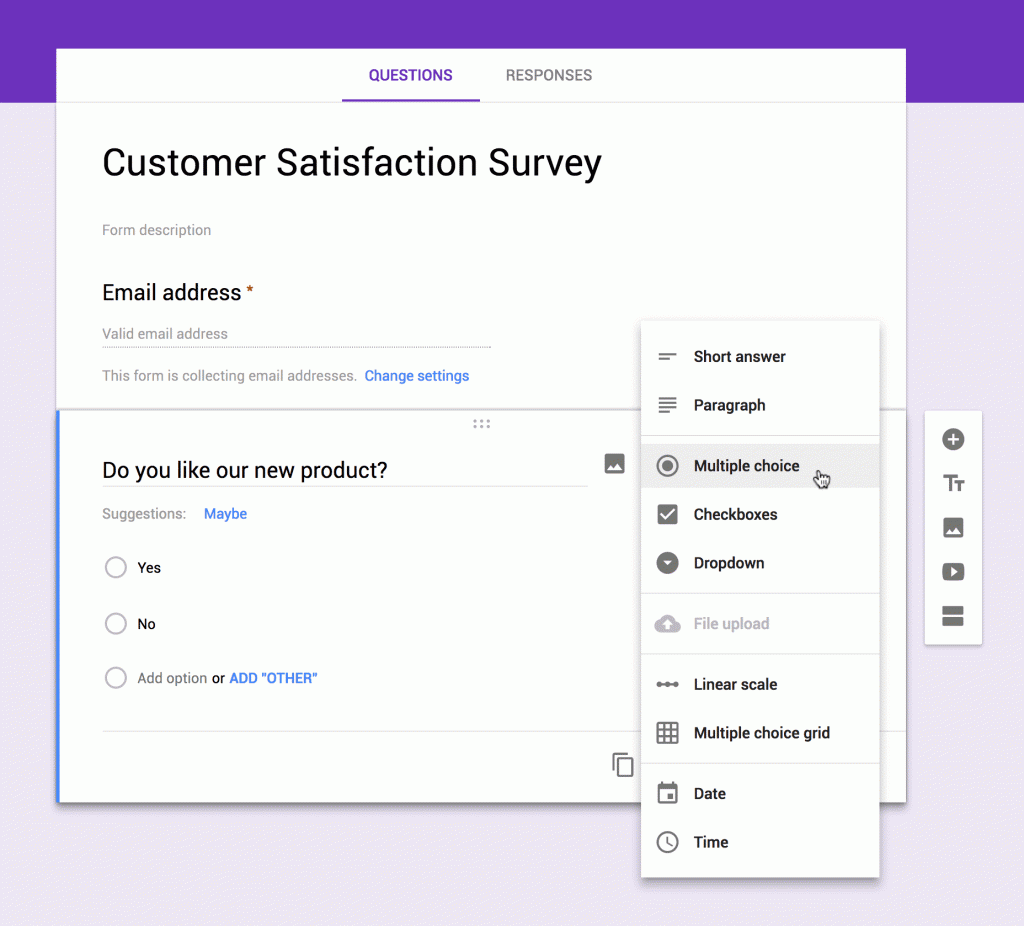
Pricing: Completely free
Features:
- Multiple choice grid (pseudo-ranking)
- Unlimited responses
- Google Sheets integration
- Simple analytics
Best for: Basic ranking needs with existing Google Workspace users
Prioneer (Best for Product Prioritization)
Pricing: Free starter plan
Features:
- ICE, RICE framework support
- Pairwise ranking
- Customer pain point research
- Team decision-making tools
Best for: Product managers and agile teams
Quick Comparison Table
| Tool | Best For | Ranking Format | CRM Integration | Lead Capture | Analytics | Mobile Experience |
| Outgrow | Business Growth | Drag-drop, Click | ✓ Native | ✓ Advanced | ✓ Real-time | ★★★★★ |
| OpinionX | Research | Multiple | ✗ | ✗ | ✓ Basic | ★★★★☆ |
| SurveyKing | Flexibility | Drag-drop, Top-N | ✗ | ✓ Basic | ✓ Basic | ★★★★☆ |
| Jotform | Customization | Orderable list | Via Zapier | ✓ Basic | ✓ Basic | ★★★☆☆ |
| Typeform | UX Design | Multiple | Via Zapier | ✓ Basic | ✓ Basic | ★★★★★ |
| Google Forms | Simplicity | Grid only | ✗ | ✗ | ✗ | ★★☆☆☆ |
| Prioneer | Product Mgmt | Pairwise | ✗ | ✗ | ✓ Focused | ★★★☆☆ |
The Verdict: Why Outgrow Leads for Business Applications
If you’re collecting ranking data for marketing research, lead generation, customer feedback, or strategic business decisions, Outgrow provides the most complete solution. While free alternatives work for basic research, Outgrow’s combination of intuitive design, marketing automation, CRM integration, and conversion optimization makes it the professional choice.
When to choose Outgrow:
- You need ranking surveys that generate and qualify leads
- CRM integration is essential to your workflow
- You want professional, branded survey experiences
- Response rate and completion rate matter to your ROI
- You need real-time insights to make faster decisions
- You’re tired of cobbling together multiple tools via Zapier
When free alternatives work:
- Academic or non-commercial research
- Internal team surveys with no external stakeholders
- One-time projects with no ongoing needs
- Budget is absolutely zero (even for high-value projects)
Survey Ranking Questions: 15 Proven Examples Across Industries
Effective survey ranking questions drive actionable insights. Here are battle-tested examples organized by use case:
Customer Experience & Satisfaction
1. Product Feature Prioritization “Rank the following features in order of importance for your daily workflow:”
- Real-time collaboration
- Advanced analytics
- Mobile app access
- Third-party integrations
- Customizable dashboards
2. Customer Service Priorities “Which aspects of customer support matter most to you? Rank from most to least important:”
- Response time
- Problem resolution quality
- Agent knowledge
- Multiple contact channels
- Follow-up communication
3. Purchase Decision Factors “When choosing a [product/service], rank these factors by influence on your decision:”
- Price
- Quality
- Brand reputation
- Customer reviews
- Warranty/guarantees
Employee Engagement & HR
4. Workplace Motivation Drivers “Rank the following factors by their impact on your job satisfaction:”
- Compensation and benefits
- Work-life balance
- Career development opportunities
- Team collaboration
- Recognition and appreciation
5. Work Culture Elements “What contributes most to a positive work environment? Rank these elements:”
- Open communication
- Flexible work arrangements
- Diversity and inclusion
- Professional development
- Social activities
6. Leadership Qualities “Rank the most important leadership qualities in your ideal manager:”
- Clear communication
- Empathy and support
- Strategic vision
- Decisiveness
- Mentorship ability
Product Development & Market Research
7. Pain Point Identification “Rank the biggest challenges you face with current solutions in this category:”
- Complexity/difficulty of use
- High cost
- Limited features
- Poor customer support
- Integration issues
8. Competitor Analysis “Based on your experience, rank these brands from best to worst:”
- Competitor A
- Competitor B
- Competitor C
- Competitor D
- Our Brand
9. New Feature Voting “We’re planning our product roadmap. Rank these potential features by value to you:”
- Feature A: [description]
- Feature B: [description]
- Feature C: [description]
- Feature D: [description]
- Feature E: [description]
Marketing & Content Strategy
10. Content Type Preferences “What content formats do you find most valuable? Rank your preferences:”
- How-to guides and tutorials
- Case studies
- Video content
- Infographics
- Podcasts
11. Communication Channel Effectiveness “Rank the channels where you prefer to receive updates from us:”
- Email newsletter
- Social media
- Mobile app notifications
- SMS/text messages
- Website announcements
E-commerce & Retail
12. Shopping Experience Elements “What matters most when shopping online? Rank these factors:”
- Free shipping
- Fast delivery
- Easy returns
- Product variety
- Customer reviews
13. Website Usability Priorities “Rank these website features by importance to your shopping experience:”
- Search functionality
- Product filtering
- High-quality images
- Detailed descriptions
- Customer Q&A section
Education & Training
14. Learning Method Preferences “Rank your preferred learning formats for professional development:”
- Live virtual workshops
- Self-paced online courses
- In-person training
- Video tutorials
- Written documentation
15. Training Topic Priorities “Which skills would benefit your role most? Rank in order of importance:”
- Technical skills training
- Leadership development
- Communication skills
- Industry-specific knowledge
- Software/tool proficiency
Forced Ranking Survey: Benefits, Drawbacks & When to Use
Forced ranking surveys require respondents to rank all items without options to skip or mark as “not applicable.” Understanding when to use this approach is crucial for data quality.
Benefits of Forced Ranking Surveys
- Complete datasets: Every respondent provides a full ranking, eliminating missing data
- Clear differentiation: Forces decision-making between closely matched options
- Reveals true priorities: Prevents “everything is important” syndrome
- Accountability: Respondents must make meaningful trade-offs
- Easier analysis: Complete rankings simplify comparative analysis
Drawbacks of Forced Ranking Surveys
- Increased respondent burden: Ranking many items is cognitively demanding
- Risk of junk data: Frustrated respondents may rank randomly to finish quickly
- Not suitable for all contexts: Forced ranking doesn’t work when items aren’t all relevant to respondents
- Higher dropout rates: More likely to abandon surveys mid-completion
- Potential bias: May force rankings on items respondents have no opinion about
When to Use Forced Ranking
✓ Use forced ranking when:
- All options are relevant to all respondents
- You need complete comparative data
- Items are opinion-based (preferences, priorities)
- Respondents have knowledge of all options
- Sample size is critical
✗ Avoid forced ranking when:
- Options vary in relevance across respondents
- List exceeds 10 items
- Respondents may lack familiarity with some options
- Survey includes multiple ranking questions
- Mobile-first audience (more difficult interface)
Best Practice: For lists over 7-8 items, use top-N ranking (rank only top 3-5 choices) instead of forcing complete rankings. Research shows rankings beyond the top and bottom three items become increasingly unreliable.
Ranking Scale for Survey Design: Best Practices & Guidelines
Creating an effective ranking scale for survey requires strategic thinking about scale length, labeling, and presentation.
Optimal Scale Length
Research-backed recommendations:
- 5-7 items: Ideal range for most ranking questions
- 8-10 items: Maximum before cognitive burden increases significantly
- 3-4 items: Minimum for meaningful ranking data
- 10+ items: Use alternative methods (top-N ranking, MaxDiff, or categorical grouping)
Studies show that respondents provide reliable rankings for the top three and bottom three items, but middle rankings become increasingly noisy and unreliable as lists grow longer.
Scale Labeling Best Practices
Clear labeling prevents confusion and improves data quality:
Always specify direction:
- ✓ “Rank from 1 (most important) to 5 (least important)”
- ✓ “Arrange in order of preference, with your favorite at the top”
- ✗ “Rank these items” (ambiguous direction)
Be consistent:
- Use the same ranking direction throughout your survey
- If 1 = highest in one question, maintain this throughout
- Consider cultural context (some regions prefer descending scales)
Provide anchors:
- Label both endpoints clearly
- Include midpoint labels for longer scales
- Use examples when helpful
Mobile Optimization
With 52.7% of survey responses coming from mobile devices in Q3 2024, mobile optimization is non-negotiable:
Design considerations:
- Pre-test ranking formats on multiple devices
- Drag-and-drop works better on desktop; consider click-to-rank for mobile
- Limit items displayed simultaneously on small screens
- Use larger touch targets (minimum 44×44 pixels)
- Consider progressive disclosure for long lists
Reducing Bias in Ranking Surveys
Randomization: Shuffle item presentation order to prevent position bias. Research shows items appearing first often receive artificially higher rankings.
Clear distinctions: Ensure items are genuinely different. Avoid overlapping concepts that confuse respondents.
Context appropriateness: Don’t ask respondents to rank vastly different items (e.g., ice cream flavors vs. political leaders). Rankings should compare items of similar magnitude and relevance.
Balanced presentation: When possible, include both positive and negative framing to reduce acquiescence bias.
Advanced Ranking Survey Analysis: From Data to Decisions
Collecting ranking data is only half the battle. Here’s how to analyze and act on your results:
Calculating Mean Rankings
The most common approach uses weighted averages where higher ranks receive greater weight:
Formula: Score = Σ (Weight × Frequency) / Total Responses
Example: For a 3-item ranking:
- 1st place weight: 3
- 2nd place weight: 2
- 3rd place weight: 1
If Item A received:
- 1st place: 5 votes (5 × 3 = 15)
- 2nd place: 3 votes (3 × 2 = 6)
- 3rd place: 2 votes (2 × 1 = 2)
Item A score: (15 + 6 + 2) / 10 responses = 2.3
Lower mean scores indicate higher average rankings (more preferred items).
Understanding First-Place Counts
Beyond mean rankings, analyze how often each item ranked first. This reveals consensus favorites and can identify “love it or hate it” items with polarized support.
Segmentation Analysis
The most valuable insights often emerge from comparing rankings across respondent segments:
- Demographics: Age, gender, location, income level
- Behavioral: Usage frequency, purchase history, customer tenure
- Psychographic: Attitudes, motivations, pain points
Example: A software company might discover that enterprise clients prioritize security features, while small businesses rank ease-of-use highest, nforming targeted marketing strategies.
Distribution Analysis
Look beyond averages to understand response patterns:
- Bimodal distributions: Two distinct preference groups exist
- Tight clustering: Strong consensus on rankings
- Wide spread: Diverse opinions with no clear winner
Competitive Positioning
When ranking includes competitor products, create positioning maps showing relative strengths and weaknesses across segments.
Common Ranking Survey Mistakes (And How to Avoid Them)
1. Lists That Are Too Long
Problem: Asking respondents to rank 15-20 items creates cognitive overload, leading to abandoned surveys or random rankings.
Solution: Limit to 6-10 items maximum, or use top-N ranking where respondents only rank their top 3-5 choices.
2. Mixing Unrelated Items
Problem: Asking respondents to rank items of vastly different importance or category creates meaningless data.
Solution: Group related items together. If categories are necessary, use multiple ranking questions or categorical sorting.
3. Neglecting Mobile Users
Problem: Complex drag-and-drop interfaces that work beautifully on desktop can be frustrating on mobile, increasing dropout rates.
Solution: Test extensively on mobile devices. Consider click-to-rank alternatives or simplified ranking for mobile users.
4. Vague Instructions
Problem: Unclear direction about ranking order (highest to lowest vs. lowest to highest) produces inconsistent data.
Solution: Explicitly state ranking direction with examples. Use visual cues and test instructions with a small group first.
5. No Option for “Not Applicable”
Problem: Forcing rankings on irrelevant items generates junk data as respondents randomly assign positions.
Solution: Unless all items are universally relevant, allow respondents to exclude non-applicable options or use screening questions first.
6. Ignoring Middle Rankings
Problem: Over-interpreting differences between positions 4, 5, and 6 when these middle rankings are statistically unreliable.
Solution: Focus analysis on top 3 and bottom 3 rankings. Treat middle positions as a cluster rather than meaningful hierarchy.
7. Using Ranking When Rating Would Work Better
Problem: Forcing comparative ranking when you actually need to know absolute satisfaction or agreement levels.
Solution: Use rating scales when you want to measure intensity of feeling. Use ranking when you need to understand relative priority or force resource allocation decisions.
Real-World Ranking Survey Success Stories
Case Study 1: SaaS Product Roadmap
Challenge: A project management software company had 15 potential features but resources to build only 5 in the next quarter.
Approach: Deployed a ranking survey to 2,500 active users asking them to rank their top 5 most wanted features.
Results:
- 68% response rate (exceptional for email surveys)
- Clear top 5 emerged with 2x more first-place votes than positions 6-10
- Segmentation revealed enterprise users prioritized security features while solopreneurs wanted automation
- Built features aligned with highest-value customer segments first
Impact: 23% increase in feature adoption, 15% reduction in churn among target segments
Case Study 2: Restaurant Menu Optimization
Challenge: A restaurant chain wanted to reduce menu complexity while maintaining customer satisfaction.
Approach: In-store tablet survey asking diners to rank menu categories by frequency of ordering and satisfaction.
Results:
- Identified 3 underperforming categories consistently ranked in bottom positions
- Discovered appetizers ranked high in satisfaction but low in order frequency (pricing issue)
- Found desserts had low satisfaction scores despite moderate ordering
Impact: Removed 2 low-ranking categories, repriced appetizers, improved dessert quality. Result: 12% increase in average check size, 18% improvement in customer satisfaction scores.
Case Study 3: Employee Benefits Redesign
Challenge: HR department with limited budget needed to understand which benefits employees valued most.
Approach: Anonymous ranking survey of all employees asking them to rank 10 benefit options from most to least valuable.
Results:
- Flexible work arrangements ranked #1 across all departments (surprising to leadership)
- Traditional perks (gym memberships, company events) ranked consistently low
- Healthcare options showed high variance by age segment
Impact: Reallocated budget from low-ranking benefits to top-ranked flexible work programs and targeted healthcare improvements. Employee satisfaction increased 31% in follow-up survey.
Ranking Survey Questions: Industry-Specific Templates
Technology & Software
“Rank the most frustrating aspects of your current solution:”
- Steep learning curve
- Frequent bugs/crashes
- Missing key features
- Poor mobile experience
- Inadequate customer support
- High cost
- Limited integrations
Healthcare
“When choosing a healthcare provider, rank these factors by importance:”
- Location/convenience
- Insurance coverage
- Physician ratings/reviews
- Wait times
- Range of services
- Technology (online booking, telemedicine)
- Cost transparency
Financial Services
“Rank your priorities when selecting a financial advisor:”
- Fee structure transparency
- Investment performance history
- Accessibility and communication
- Breadth of services offered
- Firm reputation
- Educational resources provided
E-commerce & Retail
“What would most improve your online shopping experience? Rank these enhancements:”
- Faster shipping options
- Virtual try-on/AR features
- Better product recommendations
- Live chat support
- Easier returns process
- More payment options
- Loyalty rewards program
Survey Ranking Best Practices: The Essential Checklist
Before launching your ranking survey, verify these critical elements:
Pre-Launch Checklist
Survey Design
- ✓ Limited to 6-10 items per ranking question (or using top-N ranking for longer lists)
- ✓ All items are clearly distinct and relevant
- ✓ Ranking direction explicitly stated
- ✓ Items randomized to prevent order bias
- ✓ Mobile-responsive interface tested on actual devices
- ✓ Instructions include examples where helpful
Technical Setup
- ✓ Survey logic prevents duplicate rankings
- ✓ Progress indicator included for longer surveys
- ✓ Save-and-continue option enabled
- ✓ Data validation rules configured
- ✓ Response time tracking enabled (to identify rushed completions)
Distribution Strategy
- ✓ Survey length under 10 minutes total
- ✓ Ranking question placed early (page 1-2)
- ✓ Incentive structure decided (if applicable)
- ✓ Target sample size calculated
- ✓ Pilot test completed with 10-20 respondents
During Data Collection
- Monitor response rates daily
- Check for data quality issues (suspicious patterns, extremely fast completions)
- Review open-ended feedback if included
- Track device type distribution
- Adjust distribution strategy if needed
Post-Collection Analysis
- Calculate weighted mean rankings
- Analyze first-place votes separately
- Create segment comparisons
- Look for unexpected patterns or bimodal distributions
- Combine with qualitative feedback for context
- Validate findings against other data sources
The Future of Ranking Surveys: Trends to Watch in 2025
1. AI-Powered Survey Optimization
Artificial intelligence is transforming ranking surveys through:
- Adaptive questioning: AI adjusts item lists based on previous responses
- Intelligent branching: Shows personalized ranking options by segment
- Quality detection: Identifies and flags low-quality responses in real-time
- Automated insights: Natural language summaries of ranking patterns
With 69% of market research professionals now incorporating AI into their work, expect sophisticated ranking tools to become more accessible.
2. Real-Time Feedback Integration
The shift toward immediate insights drives real-time ranking survey deployment:
- Post-purchase ranking surveys trigger automatically
- In-app ranking widgets collect feedback during product use
- Event feedback captured via mobile-optimized ranking surveys
- Continuous tracking shows how rankings evolve over time
3. Voice and Conversational Ranking
As voice interfaces mature, expect ranking surveys to adapt:
- “Hey Siri, rank these options for me”
- Conversational chatbots facilitating ranking through dialogue
- Voice-first ranking for accessibility
4. Enhanced Visualization
Modern ranking tools increasingly offer:
- Interactive results dashboards
- Animated transitions showing ranking changes over time
- Heat maps displaying segment differences
- Shareable infographics for stakeholder communication
5. Privacy-First Data Collection
With GDPR and CCPA regulations, ranking survey tools emphasize:
- Anonymous data collection by default
- Clear consent mechanisms
- Respondent data deletion capabilities
- Transparent data usage policies
How Outgrow Empowers Better Ranking Surveys
Creating engaging, high-converting ranking surveys requires more than basic form builders. Outgrow provides the tools modern marketers need:
Interactive Survey Experiences
- Visual engagement: Beautiful, on-brand survey designs that increase completion rates
- Conditional logic: Show relevant ranking questions based on previous answers
- Multi-channel deployment: Embed surveys on websites, share via social media, or distribute via email
- Mobile-first design: Seamless experiences across all devices
Advanced Analytics
- Real-time insights: Watch responses come in and identify trends immediately
- Segmentation: Automatically segment respondents and compare ranking patterns
- Integration capabilities: Connect with your CRM, marketing automation, and analytics platforms
- Custom reporting: Generate stakeholder-ready reports in minutes
Lead Generation Integration
- Data capture: Collect contact information alongside ranking data
- Lead scoring: Automatically score leads based on ranking responses
- CRM sync: Push ranking data directly to Salesforce, HubSpot, or other platforms
- Follow-up automation: Trigger personalized campaigns based on ranking patterns
Conclusion: Mastering Ranking Surveys for Better Business Decisions
Ranking surveys represent one of the most powerful tools in the modern researcher’s arsenal, transforming abstract preferences into actionable priorities. As the market research industry continues its growth trajectory, reaching $140 billion globally, the organizations that master ranking survey methodology gain a decisive competitive advantage.
Whether you’re prioritizing product features, allocating marketing budgets, improving employee engagement, or understanding customer preferences, ranking survey questions force meaningful trade-offs that reveal true priorities. By following the best practices outlined in this blog, from selecting the right free survey ranking tool to crafting effective ranking scale questions and analyzing results through segmentation, you’ll transform customer feedback into strategic clarity.
The key is starting with clear objectives, choosing appropriate ranking methodologies, designing mobile-optimized experiences, and focusing your analysis on the most reliable data points (top and bottom rankings). Remember that ranking surveys work best when all items are relevant, lists are manageable (5-7 items ideally), and you combine quantitative rankings with qualitative follow-up for full context.
Ready to create ranking surveys that drive decisions? Explore Outgrow’s interactive survey builder and start collecting the prioritized feedback your business needs to move forward with confidence.
Start Your Free Trial | View Survey Templates | Pricing
Frequently Asked Questions About Ranking Surveys
Ratings evaluate items independently on scales. Rankings order items comparatively. Use ratings for intensity measurement; rankings reveal true priorities.
Optimal range is 5-7 items. Maximum 8-10 items. Use top-N ranking for longer lists to maintain data quality.
Ranking questions prioritize features, compare competitors, allocate resources, identify pain points, and reveal relative importance for decision-making.
Calculate weighted mean rankings, analyze first-place votes separately, segment by demographics, and focus on top-three and bottom-three positions.
Yes. Free tools include Outgrow, OpinionX, SurveyKing, Google Forms, Jotform, and Prioneer. Each offers different features and limitations.
Forced ranking requires respondents to rank all items without skipping. Use only when all items are relevant to every respondent.
Use a multiple choice grid with items as rows and rankings as columns. Enable required responses and one-response-per-column limits.
A ranking scale orders items from highest to lowest priority. Optimal length is 5-7 items with clearly labeled endpoints.
Keep 5-7 items maximum, state ranking direction clearly, randomize order, test on mobile, and place early in surveys.
Keep total time under 10 minutes. Single ranking questions take 30-90 seconds. Include progress indicators to reduce abandonment rates.

Ankit Upadhyay is a Digital Marketing and SEO Specialist at Outgrow. With a passion for driving growth through strategic content and technical SEO expertise, Ankit Upadhyay helps brands enhance their online visibility and connect with the right audience. When not optimizing websites or crafting marketing strategies, Ankit Upadhyay loves visiting new places and exploring nature.