Introduction
Table of Contents
Should you rent or buy? This question probably bounces around in your head every time the notice for your lease renewal shows up, or you scroll past another house listing online. Down payments and taxes, surprise repairs, plus that nagging thought: Invest the cash and make more sense.
Here’s where a rent vs buy calculator helps. Type in your actual numbers and see what works for your situation right now. No more 2 AM spreadsheet sessions or endless debates about whether you can really swing that mortgage payment.
Think you know the costs? Most people miss stuff on both sides. Your rent goes up every year. Have you factored that in for the next decade? And buyers, that $400,000 house comes with property taxes, insurance, maintenance, and fees that add up fast. A solid calculator reveals what you’re not seeing before you sign anything.
What Is a Rent vs Buy Calculator?
It’s a tool that compares renting costs against buying costs over whatever timeframe you pick. You enter your monthly rent, the home prices you’re eyeing, your down payment savings, current mortgage rates, and how long you expect to stay put. Then it does the math and shows both options side by side.

What goes into the calculation:
- Your monthly mortgage amount (principal plus interest)
- Property taxes are based on location
- Home insurance, and PMI if you’re putting down under 20%
- Maintenance – figure 1-2% of the home’s value yearly
- What your down payment money could earn elsewhere
- How much rent climb each year
- Whether home values go up or down
- Tax deductions from mortgage interest
- Closing costs for buying and later selling
The calculator spits out a break-even point. That’s when buying costs less than renting would have. In Dallas, maybe it’s 4 years. In San Francisco, possibly 13 years. Your mileage varies.
Why You Need a Housing Cost Calculator
Housing takes the biggest bite from your paycheck. Mess this up, and you’re looking at a six-figure mistake over time. A home affordability calculator matters because:
- Monthly payments lie. Rent costs $2,000, and the mortgage is $2,100. Seems close. But throw in $600 for taxes, $200 for insurance, $300 for maintenance budget, maybe $150 in HOA fees. Now you’re at $3,350 monthly for ownership. Big difference.
- Your city isn’t like other cities. Austin’s math looks nothing like Philadelphia’s math. Use a mortgage vs rent comparison tool that factors in your actual market, not generic national averages pulled from who knows where.
- Rates flip everything. When interest rates sat at 3%, buying beat renting almost everywhere if you stayed 5+ years. At 7%? Different story entirely. Punch in current rates and see if waiting makes sense.
- Run your scenarios. Got a $30,000 gift from family? Keep renting and save another $20,000? Buy something cheaper and put 20% down? Play with a buy or rent decision tool until something clicks.
- Get past your feelings. Want a backyard? Hate yard work? Fine – but know the dollar cost of your preference. Make an informed choice instead of a guess.
How Outgrow’s Interactive Content Helps Your Decision
Outgrow takes the basic rent or buy home calculator and makes it actually useful instead of confusing.
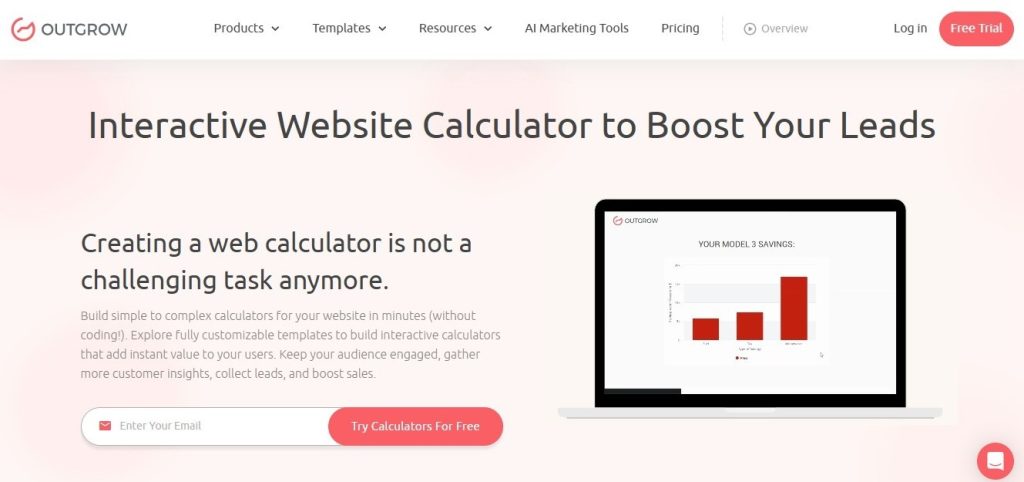
Regular calculators throw numbers at you. Outgrow calculator maker creates an experience that walks you through the process step by step, explaining what each question means and showing results as you adjust things. You don’t need an MBA to figure it out.
The platform uses conditional logic – A fancy term for “it adapts to your answers.” First-time buyers see different questions than someone selling their current place. High earners get asked about tax brackets; others skip that entirely. You only deal with questions that matter for your situation.
Visual comparisons turn boring numbers into charts you can actually understand. Monthly costs stacked next to each other. Color coding that highlights which option costs less at different points. Much better than squinting at a wall of text.
Outgrow’s builder lets financial advisors, real estate agents, and fintech companies create custom tools without hiring developers. You control the formulas, slap your branding on it, and embed it wherever. Just drag, drop, and set things up.
The real kicker? Lead generation is built right in. Users get their personalized results after sharing their email. You’re capturing qualified leads actively researching a huge financial decision. These aren’t random people clicking around – they’re ready to move forward.
Try Outgrow’s Ready-to-Use Rent vs Buy Calculator
Before building your own, check out Outgrow’s premade rent vs buy calculator here. It’s live and ready to use right now, perfect for testing how these tools work before customizing your own version.

- Monthly rent amount – What you’re currently paying
- Home purchase price – The house you’re eyeing
- Down payment percentage – How much you’ve saved
- Mortgage interest rate – Current rates you’re quoted
- Mortgage term – Usually 15 or 30 years
- Annual property taxes – Specific to the home’s location
- Homeowners insurance – Yearly cost estimate
- Years you’ll stay – Your realistic timeline
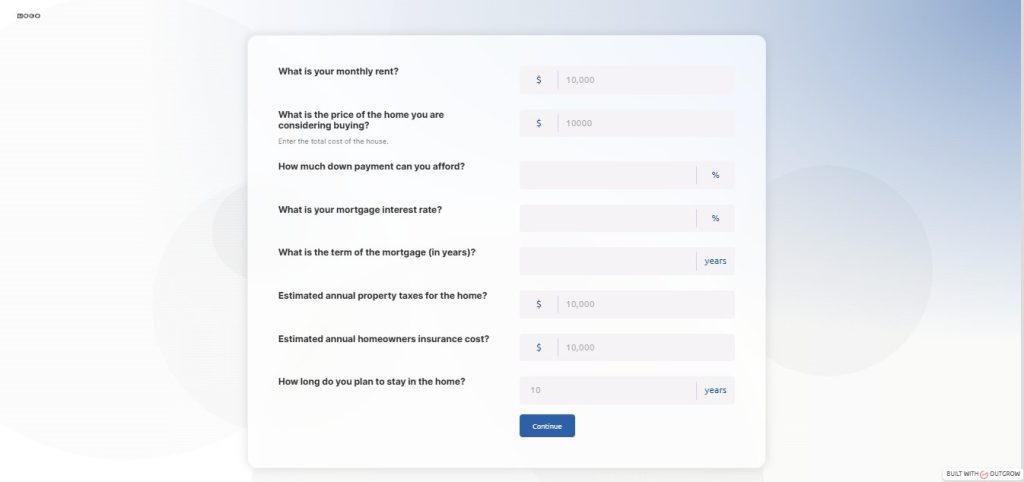
Takes about 80-90 seconds to complete. The calculator processes everything and displays whether buying or renting is more economical for your situation. Results display immediately – no waiting, no complicated interpretation needed.
What makes this premade version useful? It’s built on real mortgage math and includes all the hidden costs people forget. Property taxes get factored in. Insurance costs count. The opportunity cost of your down payment matters in the calculation. You’re seeing the full financial picture, not just monthly payment comparisons.
Try it with your actual numbers first. Then run it again with different scenarios. What if rates drop a point, or you saved another $15,000 for a down payment, or if you stayed 10 years instead of 5? Playing with variables shows you which factors actually move the needle on your decision.
Real estate agents embed this calculator on their sites to capture buyer leads. Mortgage brokers use it to show prospects when buying makes sense. Financial advisors walk clients through it during planning sessions. It works because it’s simple, accurate, and gives clear answers.
The calculator includes Outgrow’s lead capture functionality. Users get results after entering their email. If you’re a business, that’s qualified leads landing in your inbox, people actively researching a $300,000+ decision.
Building Your Own Calculator with Outgrow
Takes maybe 30 minutes to build one. Grab a template or start blank using the free online survey tool.
Questions you’ll need:
- Monthly rent (current or projected)
- Home price target
- Down payment saved
- Mortgage rate quoted
- Local property tax rate
- Home insurance estimate
- Maintenance budget guess
- Years you’ll stay
- Annual rent increase expectation
- Home value growth guess
Setup is straightforward. Outgrow’s formula builder lets you reference answers and do math – like Excel, but less annoying. It formats currency and percentages automatically.
Pick your layout. Multi-step walks users through one question per screen. Single-page shows everything at once. Add explanations and examples so people know what numbers to use.
The results page matters most. Show monthly cost comparison, break-even year, total 5-year cost difference, and advice. Use the free quiz maker tools to customize messages – “buying saves you $85K” or “rent another 3 years and save.”
Connect it to your systems. Link to your CRM, email software, Slack – whatever. When someone finishes, their data flows where you need it. Trigger emails, assign leads, start nurture sequences.
Industry Use Cases for Rent vs Buy Calculators
- Real Estate Agents stick calculators on their sites to catch buyer leads early. Someone realizes they can afford a house, and the agent gets their info and budget. Works as a lead magnet while actually helping people. Use the free form builder to ask about neighborhood preferences, too.
- Mortgage Lenders warm up visitors before pitching loans. Show them the savings from buying, then offer pre-approval. Much smoother than hitting people with applications immediately.
- Financial Advisors fold housing calculators into bigger financial plans. Helps clients align home decisions with retirement and investment goals.
- Relocation Companies help transferred employees understand new city costs. The calculator compares their current market to wherever they’re moving. Speeds up decision-making.
Getting Started: From Idea to Live Calculator
Pick a template or start blank using the free survey tool interface. Name your project something you’ll recognize later when you’re managing multiple calculators.
Add questions using the questionnaire maker’s free tools. Drag in number inputs for financial figures, dropdowns for preset options, and sliders for ranges. Each type changes how users interact.
Write helpful explanations. Users shouldn’t have to guess what “expected appreciation rate” means. Add a tooltip explaining typical ranges (2-4% in most markets works). Good explanations reduce people bailing halfway through.
Set up your formulas. Reference answers by their variable names. Multiply the monthly rent by 12 and by years to get the total rent paid. Calculate mortgage payments using the standard formula (or Outgrow’s built-in mortgage function). Add all buying costs, compare totals.
Design a results page that people can scan quickly. Big numbers in large fonts grab attention. Charts beat paragraphs of text. Recommendations provide a direction toward next steps, such as a clear call-to-action. Consultation guide, etc.
Test everything thoroughly. Run the calculator with different scenarios. Check formulas work at extremes (zero down payment, 50% down, 1 year timeline, 30 years). We should fix bugs before launch.
You can easily embed it on your website using the different embed options or share the direct link.
Common Mistakes to Avoid
- Only comparing monthly payments. Rent is $2,500, mortgage is $2,600, close enough! Except you forgot $800 in taxes, insurance, and maintenance. Real ownership cost: $3,400. Not so close anymore.
- Ignoring opportunity cost. Your $75,000 down payment could grow at 8% in the market. That’s $161,000 after 10 years. The calculator counts this – do you?
- Crazy appreciation estimates. Using 10% yearly home value growth? Sure, buying looks amazing. Reality is closer to 2-4% long-term. Use realistic numbers, or you’re fooling yourself.
- Wrong timeline. Moving in 18 months? Buying probably costs more once you add closing costs both ways. Stay 10 years? Different math entirely. Be honest about your timeline.
- Flat rent assumption. Thinking rent stays $2,000 forever? Your landlord bumps it 3-5% yearly. Over a decade that adds up. Factor in increases.
- Lowball maintenance. First-timers always underestimate repairs and upkeep. Start at 1% of home value yearly minimum. That $500,000 house costs $5,000-$10,000 yearly to maintain.
Maximizing Calculator Effectiveness
Stick your calculator where house hunters already look. Blog posts about rent vs buy decisions work great. The homepage hero section catches everyone. Landing pages from ads convert best.
Write content that links to the calculator. Market analysis posts, first-time buyer guides, neighborhood comparisons. Each article should point to the tool.
Run ads straight to the calculator page. Someone Googling “should I buy or rent” wants answers, not fluff. Give them the tool immediately. Lower cost per lead, higher conversion.
Share findings on social media. “Break-even in Portland: 7.3 years.” People love local data. Gets clicks and shares.
Reading Your Results
- The monthly comparison shows rent payment versus total ownership cost (mortgage, taxes, insurance, maintenance, HOA). Tells you what you’ll actually pay each month.
- The break-even year is when buying becomes cheaper than renting. Move before this? Renting probably wins. Stay past it? Buying saves money.
- Total cost adds everything over your timeframe. Includes the opportunity cost of the down payment. The real comparison number.
- Equity gained shows how much of the house you’d own. After 10 years, maybe 25-30%. Acts like forced savings.
Look at the whole picture. Buying saves $3,000 over 10 years? That’s basically a tie; go with lifestyle preference. Buying saves $120,000? That’s real money worth considering seriously.
Wrapping Up
A rent vs buy calculator turns a confusing money decision into clear numbers. Build one with Outgrow’s tools or use what’s out there, just run the math before committing.
The calculator won’t decide for you. Career plans, family situations, lifestyle preferences all matter. But it removes the financial guesswork. You’ll know actual costs, when buying makes sense, and potential savings.
For real estate pros, mortgage lenders, and financial advisors, calculators do double duty. Help users while capturing qualified leads who are ready to move forward. The free online survey tools make building these accessible without hiring developers.
Punch in your numbers. Try different scenarios. Make a housing choice based on facts instead of guesses. Sign up for a free 7-day trial today and start building your customizable calculator.
Frequently Asked Questions
It compares the total cost of renting against buying over time. It asks you to input the current rent amount, home price, down payment, interest rate, and period of stay. The calculator then works backward to calculate mortgage payments, property taxes, insurance, maintenance, and opportunity costs while showing which of the two costs is less.
Calculators provide estimates according to what you put into them. Their accuracy depends on how realistic the numbers are: actual interest rates in your area, correct property taxes, and honest estimates for maintenance. The results one gets from any calculator will indicate the direction and not a precise prediction because markets continuously change.
Completely depends on your market and situation. The usual is 3-15 years. Lower-cost cities with high rents might break even in 3-5 years. Expensive coastal markets may need 10-15 years. Your specific numbers determine where your break-even point is.
It tells you if buying is more within your budget compared to renting. True affordability is a function of income, previously incurred debt, and savings. For real estate, most lenders prefer that it does not exceed 28% of gross income. Calculator results plus pre-approval quotes are two elements needed for completeness.
With Outgrow, you are able to build custom, branded calculators containing conditional questions that change based on the user’s answers. Capped with lead capture, connection of CRM, visualization of results, and no coding-just control formulas and design yourself while collecting qualified leads.

Muskan is a Marketing Analyst at Outgrow. She is working on multiple areas of marketing. On her days off though, she loves exploring new cafes, drinking coffee, and catching up with friends.