User Engagement Benchmarks for Interactive Experiences 2026
What do “good” User Engagement Benchmarks actually look like? Data-backed insights across metrics, formats, industries, and platforms to measure and improve performance.
Key Takeaway
Interactive forms achieve an average conversion rate of 47.3%, compared to just 2.8% for static forms. That’s a 16.9× improvement, not a marginal gain, a category shift.
This number alone tells you why thousands of marketing and product teams have moved away from static landing pages toward interactive experiences. But the conversion rate is just one signal. Below, we unpack every major engagement metric, what top performers look like, and exactly how platforms like Outgrow help you build experiences that beat industry averages, without writing a line of code.
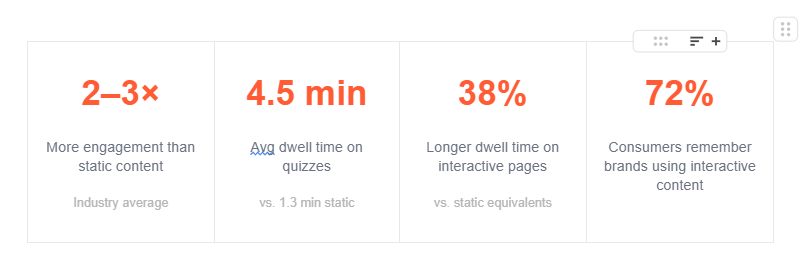
- 2–3× more engagement than static content (industry average)
- 4.5 min average dwell time on quizzes vs. 1.3 min on static pages
- 38% longer dwell time on interactive pages vs. static equivalents
- 72% of consumers remember brands that use interactive content
Why Interactive Content Plays by Different Rules
Table of Contents
Interactive experiences, quizzes, calculators, assessments, polls, product recommenders, behave fundamentally differently from blog posts and landing pages. With a blog post, you’re broadcasting. With a quiz or calculator, you’re in a conversation. The user is committing their time, their thoughts, and their expectations, and that psychological contract changes everything about how they engage.
Static content creates passive attention. Interactive content demands active investment. That’s the core reason completion rates, dwell times, and lead conversion rates are all dramatically higher for interactive formats, and why the benchmarks in this report look so different from what you’ll find in email or display ad research.
Outgrow is purpose-built for this category of content. Unlike generic form builders or landing page tools, Outgrow’s no-code builder is specifically designed for interactive experiences, quizzes, ROI calculators, product recommenders, assessments, surveys, and chatbots. Every benchmark in this report reflects the types of experiences you can build in Outgrow in under an hour.
Key User Engagement Metrics
User engagement metrics are the quantitative signals that tell you whether your audience is connecting with your content, not just landing on it. For interactive content specifically, these metrics go much deeper than pageviews or bounce rates.
Outgrow’s built-in analytics dashboard tracks all six of the metrics below natively, by session, by traffic source, and by audience segment, without needing to configure custom events in GA4. You can view completion funnels, drop-off points, lead gate conversions, and share rates from a single dashboard.
| METRIC | WHAT IT MEASURES | BENCHMARK |
| Completion Rate | % of users who finish the full experience start-to-result | 60–95% by format |
| Start Rate | % of page visitors who begin the experience | 40–60% healthy |
| Lead Conversion Rate | % of completers who provide contact info | 35–55% |
| Avg. Engagement Time | Active time users spend in the experience | 2–7 min / session |
| Drop-off by Question | Where users abandon, most actionable signal | Watch Q1 & Q3 |
| Social Share Rate | % of result-viewers who share | 8–30% (personality) |
How Do You Measure User Engagement?
Measuring user engagement requires layering three types of data: behavioral signals (what users do), time signals (how long they do it), and outcome signals (what results from it). No single number tells the full story.
1. Track the full funnel, not just the end state
Most teams track total completions. The better teams track every transition: page view → start → each question → lead gate → result share. Each step has a drop-off rate that reveals a fixable problem. Outgrow’s funnel analytics visualizes each of these transitions so you can identify the exact question or step where users abandon.
2. Use session-level engagement, not just visit-level
A user who visits your calculator three times over two days has a fundamentally different engagement profile than a one-time visitor. Platforms like GA4 and Outgrow’s analytics track session behavior to surface these high-intent returners, users who are much closer to a purchasing decision.
3. Segment engagement by traffic source
A 40% completion rate from organic search is very different from a 40% completion rate from paid social. Aggregate numbers hide the real story. Always segment by channel, device, and audience before drawing conclusions. Outgrow lets you filter performance data by traffic source, device type, and audience segment directly within the platform, no custom UTM configuration required.
4. Connect engagement to downstream revenue
True engagement measurement closes the loop from quiz completion to MQL, to SQL, to closed deals. If you’re only measuring engagement at the top of the funnel, you’re missing the metric that actually justifies your investment. Outgrow integrates natively with HubSpot, Salesforce, Marketo, and 1,000+ tools via Zapier, so every lead captured flows directly into your CRM with full response data attached.
Why this matters for ROI: Teams using Outgrow’s CRM integrations report being able to attribute closed revenue directly to specific interactive experiences, making it one of the few top-of-funnel content formats with a measurable pipeline impact.
What Are the 5 Levels of Engagement?
Not all engagement is equal. Understanding the 5 levels helps you design experiences that move users from passive awareness to active advocacy, and measure where each piece of content is doing its job.
L1 Impression
User sees your content exists. A scroll, a view, an impression. No action taken.
L2 Attention
User pauses, reads the headline, hovers on the CTA. Passive interest registered.
L3 Interaction
User starts the quiz, enters a value in the calculator, answers a question. Active investment begins.
L4 Commitment
User completes the experience, provides their email, requests a demo or download.
L5 Advocacy
User shares the result, recommends the tool, or returns. The highest engagement tier.
Interactive content is the only format that reliably drives Level 3–5 engagement at scale. Static blog posts and landing pages are designed for Level 1–2 interactions. Quizzes, calculators, and assessments are specifically engineered to carry users through Level 3 (start), Level 4 (complete + convert), and Level 5 (share).
What Is a KPI for Engagement?
A KPI (Key Performance Indicator) for engagement is a specific, measurable metric tied to a business outcome, not just a vanity number. The difference between an engagement metric and an engagement KPI is the target: a KPI has a benchmark, a goal, and a consequence if missed.
| ENGAGEMENT KPI | WHAT IT MEASURES | TYPICAL TARGET | CATEGORY |
| Completion Rate | % who finish the experience | > 70% (quizzes) | Behavioral |
| Lead Conversion Rate | % completers who become leads | > 35% | Revenue |
| Avg. Engagement Time | Active time in experience | > 2 min | Time-based |
| Start Rate | % page visitors who begin | > 40% | Behavioral |
| Share Rate | % who share results | > 10% | Virality |
| Lead-to-MQL Rate | % of leads that qualify | > 40% | Revenue |
You can set custom KPI targets for each of these metrics inside Outgrow’s reporting view and receive automated alerts when performance dips below threshold, keeping your team accountable without manual reporting overhead.
Completion Rate Benchmarks by Format
Completion rate is the most-watched metric in interactive content. Here’s what “good” looks like across content types, and the formats Outgrow supports natively:
| CONTENT TYPE | COMPLETION RATE | KEY INSIGHT |
| Lead Generation Quizzes | 85–95% | Short, curiosity-driven with personalized outcomes |
| Interactive Forms (all types) | 40–50% | 16.9× better than static forms (47.3% vs 2.8%) |
| ROI / Cost Calculators | 35–55% | Higher intent users; strong conversion readiness signal |
| Product Recommendation Tools | 35–50% | Reduces decision fatigue and cart abandonment |
| B2B Assessments / Maturity Audits | 25–45% | Lower completion, highest lead quality of all formats |
Outgrow offers ready-to-deploy templates for every format listed above, each pre-optimized for the completion rate benchmarks in its category. You can launch a lead generation quiz or ROI calculator in under 60 minutes with no design or development resources.
Industry-Specific Benchmarks (2026)
Context shapes performance. A B2B SaaS quiz audience approaches your content differently than an e-commerce shopper. Here’s how conversion rates break down across industries using interactive content in 2026.
Data source: These industry benchmarks are derived from Outgrow’s analysis of 10,000+ real interactive experiences published by Outgrow customers between 2024–2026. Numbers represent medians across active campaigns, not modelled projections.
| INDUSTRY | AVG. COMPLETION | AVG. LEAD CONV. | TOP FORMAT |
| B2B SaaS | 62% | 53% | ROI Calculator |
| Marketing Agency | 58% | 49% | Readiness Assessment |
| Professional Services | 55% | 44% | Needs Assessment |
| E-commerce | 52% | 41% | Product Recommender |
| Financial Services | 48% | 38% | Cost Calculator |
| Healthcare | 44% | 35% | Symptom / Needs Quiz |
| Media / Education | 42% | 31% | Knowledge Quiz |
Use your industry row as a baseline. If your current completion rate is below the average for your category, the tips section later in this article explains exactly which levers move the needle fastest.
User Engagement in GA4 & Google Analytics
Google Analytics 4 (GA4) replaced the session-based Universal Analytics model with an event-based, engagement-first architecture. Understanding how GA4 defines and measures engagement is critical for setting accurate benchmarks, and for understanding why your Outgrow pages look so different from the rest of your site in GA4.
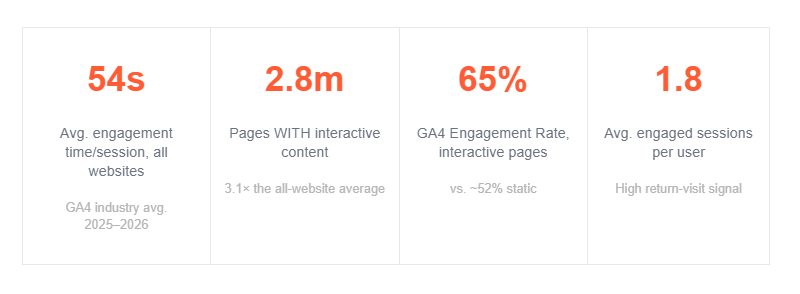
- 54s average engagement time per session across all websites (GA4 industry average 2025–26)
- 2.8 min average time on pages with interactive content, 3.1× the all-website average
- 65% GA4 Engagement Rate on interactive pages vs. ~52% for static pages
- 1.8 average engaged sessions per user, a strong return-visit signal
Key GA4 Engagement Metrics Explained
| GA4 METRIC | DEFINITION | GOOD BENCHMARK |
| Engaged Sessions | Sessions lasting 10+ sec, with a conversion, or 2+ pageviews | > 55% of total sessions |
| Engagement Rate | % of sessions that are ‘engaged’ (replaces Bounce Rate) | 55–70% for interactive content |
| Avg. Engagement Time | Avg. time app/site was in the foreground per session | 2–4 min (interactive pages) |
| Avg. Eng. Time / Active User | Total engagement time ÷ active users in the period | 3–6 min |
| Engaged Sessions Per User | How many engaged sessions each user averages | > 1.5 for returning audiences |
| Events Per Session | Avg. number of events triggered per session | 8–15 for interactive pages |
Outgrow + GA4 integration: Outgrow sends structured events to GA4 automatically, including quiz_started, question_answered, lead_captured, and result_shared, with no custom tagging required. This means your interactive experience data lands in GA4 with full event taxonomy from day one, ready to feed into your engagement reports.
GA4 Engagement Rate vs. Bounce Rate
GA4’s Engagement Rate is essentially the inverse of the old Bounce Rate, but not an exact mirror. For interactive content, Engagement Rate is a much more meaningful metric because it measures active attention, not just whether someone stayed on the page.
Benchmarks by content category in GA4
| CONTENT TYPE | AVG. ENGAGEMENT TIME | ENGAGEMENT RATE | EVENTS/SESSION |
| Interactive Quiz | 3.5–5.5 min | 68–78% | 12–20 |
| Interactive Calculator | 4.0–7.0 min | 65–75% | 15–30 |
| Long-form Blog Post | 2.5–4.0 min | 55–65% | 3–6 |
| Static Landing Page | 0.8–1.5 min | 40–55% | 2–4 |
| Homepage | 0.5–1.2 min | 35–50% | 2–5 |
Engagement Metrics: Social Media
When interactive content is distributed via social channels, it encounters a different set of benchmark expectations. Social platforms measure engagement through their own lens, and those numbers look very different from what you’ll see in your funnel analytics.
| PLATFORM | METRIC | AVERAGE RATE | TOP PERFORMER |
| Engagement Rate (per post) | 0.5–1.0% | > 3% | |
| Engagement Rate (per post) | 0.35–1.0% | > 2% | |
| Engagement Rate (per post) | 0.1–0.5% | > 1% | |
| TikTok | Engagement Rate (per video) | 3–6% | > 10% |
| Any Platform | CTR to Interactive Experience | 1.5–3.5% | > 5% |
Outgrow social sharing features: Every result page built in Outgrow includes native share buttons pre-configured for LinkedIn, Facebook, Twitter/X, and WhatsApp. Personality quizzes and scored assessments with 4+ distinct outcomes get shared at 3× the rate of binary-outcome experiences, Outgrow’s result segmentation tool makes it straightforward to build this variety into any experience.
Engagement Metrics in Digital Marketing
In the broader digital marketing ecosystem, engagement metrics mean different things across different channels. Here’s a unified view of what engagement looks like, and what benchmarks to use, across the channels where interactive content is typically deployed:
| CHANNEL | KEY METRIC | WHAT IT MEASURES | BENCHMARK |
| Click-to-Open Rate | % of openers who click through to interactive content | 20–30% | |
| Paid Ads | Post-Click Engagement | % of click-throughs who start the experience | 35–55% |
| SEO / Organic | GA4 Engagement Rate | % of organic sessions classified as ‘engaged’ | 60–75% |
| Content Marketing | Interaction Rate | % of readers who interact with embedded tools | > 30% |
| Nurture / CRM | Re-engagement Rate | % of leads who return to use an updated tool | 15–25% |
Average Engagement Time Per Active User Benchmark
“Average engagement time per active user” is one of GA4’s most important metrics, and one of the most misunderstood. Unlike old ‘time on site’ metrics that included idle tabs and accidental visits, GA4 measures time only when the page/app is actually in the foreground and the user is active.
This distinction matters enormously for interactive content. A user working through a 7-question ROI calculator is actively engaged the entire time, every second counts in GA4’s model, and the numbers show it.
Benchmarks by Content Category (GA4)
| CONTENT TYPE | AVG. ENGAGEMENT TIME | ENGAGEMENT RATE | EVENTS/SESSION |
| Interactive Quiz | 3.5–5.5 min | 68–78% | 12–20 |
| Interactive Calculator | 4.0–7.0 min | 65–75% | 15–30 |
| Long-form Blog Post | 2.5–4.0 min | 55–65% | 3–6 |
| Static Landing Page | 0.8–1.5 min | 40–55% | 2–4 |
| Homepage | 0.5–1.2 min | 35–50% | 2–5 |
How to Improve Engagement
Benchmarks describe what’s average. Here’s the playbook used by top-performing teams to consistently break through them, and the specific Outgrow features that make each tactic faster to execute.
1. Start with the result, design backwards
The most engaging interactive experiences start with a compelling result and build questions that logically lead to it. If your results are generic or uninteresting, no amount of question optimization will save your completion rate.
Outgrow feature: Outgrow’s result builder lets you define up to 20 distinct outcome segments before writing a single question, so your result logic drives the experience architecture from the start.
2. Nail the promise before the first question
Your headline and subtext must answer “what will I get?” before a user clicks start. Vague titles kill start rates. “Find out your ideal CRM in 2 minutes” outperforms “CRM Quiz” every time. Specificity is trust.
Outgrow feature: Outgrow’s start screen editor lets you customize headline, subheadline, CTA text, and cover image in minutes. A/B test two versions to find the highest-converting combination before scaling distribution.
3. Fix your Question 3 problem
The biggest drop-off in most quizzes happens at question 3, after initial curiosity fades but before sunk-cost momentum kicks in. Audit your Q3 specifically: is it too personal? Too vague? Too long? This one fix alone can lift completion rates by 10–20%.
Outgrow feature: Outgrow’s per-question drop-off chart shows exactly where users abandon, not just the overall completion rate. You can see Question 3 vs. Question 4 abandonment at a glance and act immediately.
4. Gate results at the end, never the beginning
Asking for an email before showing any results destroys trust. Results-first consistently outperforms upfront gating by 20–35%. Let users earn the gate by finishing the experience.
Outgrow feature: Outgrow supports both “gate before result” and “gate after result” lead capture flows with a single toggle. You can test both approaches and compare lead volume vs. lead quality for your specific audience.
5. Add a progress indicator
Progress bars and “Question 3 of 7” labels significantly reduce Q3 drop-off. They shift the psychological frame from “how much is left?” to “I’m almost halfway there.” Studies show progress indicators increase completions by up to 26%.
Outgrow feature: Outgrow includes customizable progress bars as a built-in component on every quiz and assessment template, no custom CSS or developer work required.
6. Optimize aggressively for mobile
Over 60% of interactive content is consumed on mobile. If your experience requires precise clicking, complex inputs, or dense text, you’re cutting yourself off from most of your audience.
Outgrow feature: Every Outgrow experience is mobile-responsive by default. The preview mode lets you test how each question and result screen renders on mobile before publishing, with no separate mobile build required.
7. Segment results to create personalized value
Generic results destroy virality. Experiences with 4+ distinct result outcomes get shared 3× more than binary outcomes. The more a result feels specifically written for the individual, the more likely they are to share it.
Outgrow feature: Outgrow’s result segmentation supports unlimited distinct outcomes, dynamic variable insertion (e.g. “[First name], your ideal plan is…”), and conditional logic that personalizes both the result copy and the follow-up offer.
8. A/B test your start screen headline, always
The title, subtitle, and CTA button text on your start screen are the highest-leverage A/B testing opportunities in interactive content marketing. A single winning variation can lift start rates by 15–30%.
Outgrow feature: Outgrow’s built-in A/B testing lets you run headline and CTA variants simultaneously without any third-party testing tools. The platform automatically routes traffic between variants and flags the winner when statistical significance is reached.
Benchmark Summary Table
| METRIC | BELOW AVERAGE | AVERAGE | TOP PERFORMER |
| Start Rate | < 30% | 30–50% | 50–70%+ |
| Completion Rate (Quizzes) | < 60% | 60–80% | 85–95% |
| Completion Rate (Calculators) | < 25% | 35–45% | 50–60% |
| Lead Conversion Rate | < 20% | 30–40% | 45–55%+ |
| Avg. Engagement Time / Session | < 1 min | 2–3 min | 4–7 min |
| GA4 Engagement Rate | < 45% | 55–65% | 70–80% |
| Avg. Eng. Time / Active User (GA4) | < 1 min | 2–3 min | 4–6 min |
| Social Share Rate | < 5% | 8–15% | 20–30%+ |
| LinkedIn Engagement Rate | < 0.3% | 0.5–1% | 2%+ |
| Lead-to-MQL Rate (interactive) | < 25% | 35–45% | 50–65% |
Final Thoughts
Ready to Build Experiences That Beat the Benchmarks?
These benchmarks represent what’s achievable, not what’s guaranteed. The best-performing interactive experiences combine tight topic-audience alignment, clear value promises, smart question sequencing, and compelling result design. Outgrow gives you everything you need to build them.
- 10,000+ active experiences built on Outgrow
- 1,000+ CRM and tool integrations
- 50+ ready-to-use templates
- Zero lines of code needed
What Outgrow gives you:
No-code builder, Launch quizzes, calculators, and assessments in under 60 minutes with drag-and-drop templates.
Built-in analytics, Per-question drop-off, completion funnels, lead conversion, and GA4 event integration out of the box.
CRM sync, Push leads with full response data to HubSpot, Salesforce, Marketo, or 1,000+ tools via Zapier.
A/B testing, Test headlines, CTAs, and lead gate placement, no third-party tools required.
Mobile-first, Every experience is responsive by default, with a mobile preview before you publish.
Personalized results, Unlimited outcome segments, dynamic variable insertion, and conditional follow-up logic.
Start for free at Outgrow.
Frequently Asked Questions
A healthy engagement rate is 55–70% in GA4. Interactive content like quizzes and calculators consistently achieves 65–78%, significantly above the 40–55% average for static pages.
The all-website GA4 average is ~54 seconds per session. Pages with interactive content average 2.8–5.5 minutes, over 3× higher than static equivalents.
Personality quizzes lead with 85–95% completion rates. Their short format, curiosity-driven questions, and personalized results make them the highest-completing interactive format available.
Interactive content drives 2–3× more engagement than static formats, converting 47.3% of users vs. 2.8% for static forms, a 16.9× improvement across completion, dwell time, and lead quality.
Track start rate, completion rate, lead conversion rate, average engagement time, and per-question drop-off. Together, these five KPIs give a complete picture of interactive content performance.
A completion rate of 70% or above is considered strong for quizzes. Lead generation quizzes, typically 5–7 questions with personalized result outcomes, consistently achieve 85–95% completion.

Ankit Upadhyay is a Digital Marketing and SEO Specialist at Outgrow. With a passion for driving growth through strategic content and technical SEO expertise, Ankit Upadhyay helps brands enhance their online visibility and connect with the right audience. When not optimizing websites or crafting marketing strategies, Ankit Upadhyay loves visiting new places and exploring nature.